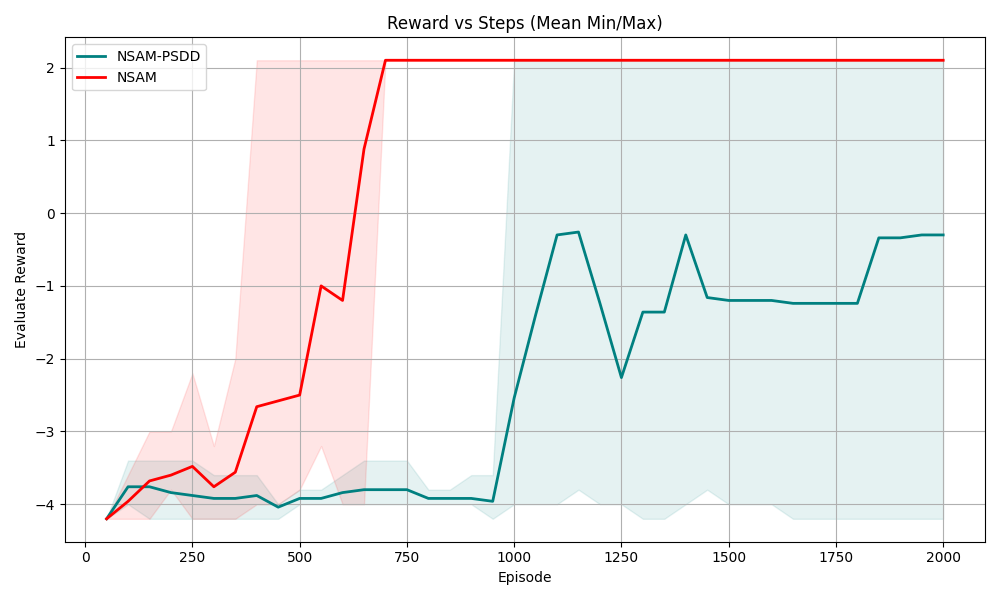
## Chart: Reward vs Steps (Mean Min/Max)
### Overview
The image is a line chart comparing the performance of two algorithms, "NSAM-PSDD" and "NSAM", over a series of episodes. The chart displays the "Evaluate Reward" on the y-axis against the "Episode" number on the x-axis. The chart also includes shaded regions representing the min/max range for each algorithm.
### Components/Axes
* **Title:** Reward vs Steps (Mean Min/Max)
* **X-axis:**
* Label: Episode
* Scale: 0 to 2000, with major ticks at 0, 250, 500, 750, 1000, 1250, 1500, 1750, and 2000.
* **Y-axis:**
* Label: Evaluate Reward
* Scale: -4 to 2, with major ticks at -4, -3, -2, -1, 0, 1, and 2.
* **Legend:** Located in the top-left corner.
* NSAM-PSDD (Teal line with light teal shaded region)
* NSAM (Red line with light red shaded region)
### Detailed Analysis
* **NSAM-PSDD (Teal):**
* Trend: Initially, the line is relatively flat around -4. After episode 1000, the line shows significant fluctuations, ranging from approximately -0.3 to -2.2. Towards the end, the line stabilizes around -0.3.
* Data Points:
* Episode 0: approximately -4.2
* Episode 250: approximately -3.9
* Episode 500: approximately -4.0
* Episode 750: approximately -3.8
* Episode 1000: approximately -3.9
* Episode 1125: approximately -0.3
* Episode 1250: approximately -2.2
* Episode 1375: approximately -1.3
* Episode 1500: approximately -1.2
* Episode 1750: approximately -1.2
* Episode 2000: approximately -0.3
* Min/Max Range: The light teal shaded region around the teal line indicates the range of reward values for NSAM-PSDD. The range is relatively narrow, suggesting consistent performance.
* **NSAM (Red):**
* Trend: The line starts around -4 and increases sharply after episode 500, reaching a plateau at approximately 2 around episode 750.
* Data Points:
* Episode 0: approximately -4.1
* Episode 250: approximately -3.5
* Episode 500: approximately -2.5
* Episode 625: approximately -1.0
* Episode 750: approximately 2.1
* Episode 2000: approximately 2.1
* Min/Max Range: The light red shaded region around the red line indicates the range of reward values for NSAM. The range widens significantly during the period of rapid increase, suggesting more variable performance.
### Key Observations
* NSAM initially performs worse than NSAM-PSDD but quickly surpasses it after approximately 500 episodes.
* NSAM-PSDD shows more stable performance, as indicated by the narrower min/max range.
* NSAM reaches a higher reward plateau than NSAM-PSDD.
### Interpretation
The chart suggests that NSAM is a more effective algorithm in the long run, as it achieves a higher reward. However, NSAM-PSDD exhibits more consistent performance, particularly in the initial stages. The shaded regions highlight the variability in performance for each algorithm, with NSAM showing a wider range during its learning phase. The data indicates a trade-off between initial stability (NSAM-PSDD) and eventual performance (NSAM).