## Line Chart with Confidence Bands: Reward vs Episode (Mean Min/Max)
### Overview
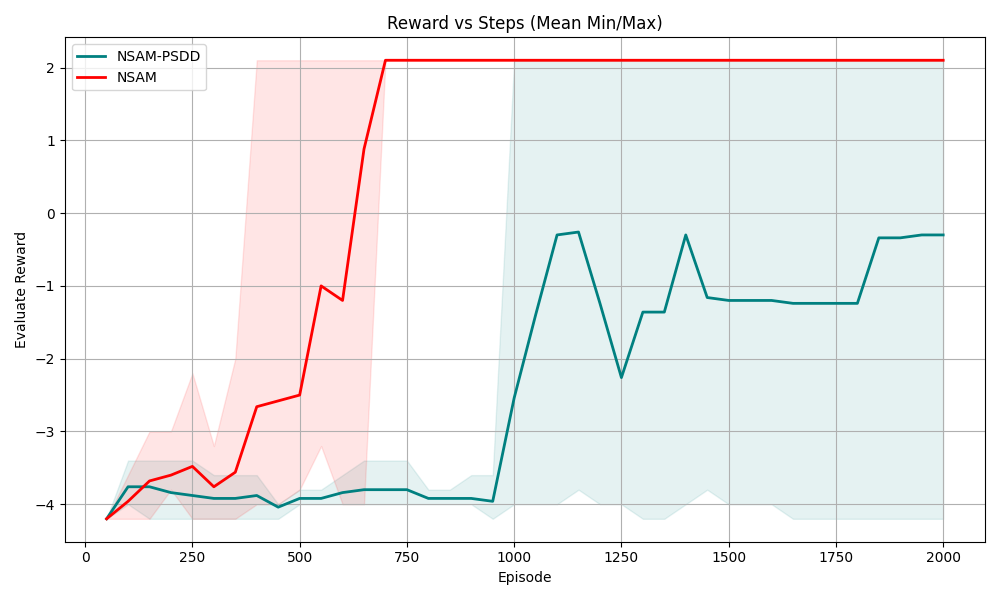
This is a line chart with shaded confidence bands (representing min/max reward ranges) that compares the learning performance of two models, **NSAM** (red) and **NSAM-PSDD** (teal), over 2000 training episodes. The chart plots *Evaluate Reward* (y-axis) against *Episode* (x-axis), with the title "Reward vs Steps (Mean Min/Max)" (note: x-axis is labeled "Episode", not "Steps").
### Components/Axes
1. **Title**: "Reward vs Steps (Mean Min/Max)" (top-center of the chart area)
2. **X-axis**: Labeled *Episode*, linear scale from 0 to 2000, with major ticks at 0, 250, 500, 750, 1000, 1250, 1500, 1750, 2000.
3. **Y-axis**: Labeled *Evaluate Reward*, linear scale from -4 to 2, with major ticks at -4, -3, -2, -1, 0, 1, 2.
4. **Legend**: Positioned top-left inside the chart area, with two entries:
- Teal line + shaded region: `NSAM-PSDD`
- Red line + shaded region: `NSAM`
5. **Confidence Bands**: Shaded regions correspond to the min/max reward range for each model, matching the line color of the model.
---
### Detailed Analysis
#### 1. NSAM (Red Line + Red Shaded Region)
- **Trend**: Starts at a low reward, shows a steady upward trend until Episode 750, then sharply jumps to the maximum reward value of 2, and remains flat at 2 for all subsequent episodes (750 to 2000).
- **Approximate Data Points**:
- Episode 0: ~-4.2
- Episode 250: ~-3.5
- Episode 500: ~-2.5
- Episode 750: 2
- Episodes 750-2000: 2 (constant)
- **Confidence Band (Min/Max)**: Wide variance from Episode 0 to ~750, with maximum values reaching ~2 (around Episode 500) and minimum values as low as ~-4. After Episode 750, the band disappears (the line is flat, so min/max equals the mean value of 2).
#### 2. NSAM-PSDD (Teal Line + Teal Shaded Region)
- **Trend**: Starts at ~-4.2, remains relatively flat (around -4 to -3.8) until Episode 1000, then shows a volatile upward trend with fluctuations, ending at ~-0.3 at Episode 2000.
- **Approximate Data Points**:
- Episode 0: ~-4.2
- Episode 250: ~-3.8
- Episode 500: ~-4.0
- Episode 750: ~-3.8
- Episode 1000: ~-2.5
- Episode 1250: ~-2.2
- Episode 1500: ~-1.2
- Episode 1750: ~-1.2
- Episode 2000: ~-0.3
- **Confidence Band (Min/Max)**: Wide variance from Episode 0 to ~1000, with minimum values as low as ~-4.5 and maximum values up to ~0 (around Episode 1000). After Episode 1000, the band narrows, with the line fluctuating between ~-2.5 and ~-0.3, and the min/max range remains persistent (e.g., at Episode 1250, min ~-4.2, max ~-0.2; at Episode 2000, min ~-4.2, max ~0).
---
### Key Observations
1. NSAM converges to the maximum possible reward (2) by Episode 750, with no further variance or improvement after this point.
2. NSAM-PSDD shows slower, unstable learning, never reaching the maximum reward, and maintains persistent variance in performance across all episodes.
3. The red confidence band (NSAM) is most prominent during the initial learning phase (0-750), indicating high variance before the model stabilizes.
4. The teal confidence band (NSAM-PSDD) remains wide even after Episode 1000, indicating the model never fully stabilizes its performance.
---
### Interpretation
This chart compares the learning efficiency and stability of two reinforcement learning models for a specific task:
- **NSAM** is highly effective for this task: it rapidly learns to achieve the maximum possible reward, and once converged, maintains perfect, consistent performance with no variance. This suggests NSAM quickly identifies and locks into the optimal policy for the task.
- **NSAM-PSDD** is less effective: it shows slow, unstable learning, never reaches the optimal reward, and retains high variance in performance. This indicates NSAM-PSDD may be exploring suboptimal policy spaces, or has a less stable learning mechanism that prevents it from converging to the optimal solution.
- The stark difference in performance suggests NSAM is far better suited for this specific task, as it achieves and maintains the highest possible reward with no further exploration or variance after convergence.