## Line Graph: Reward vs Steps (Mean Min/Max)
### Overview
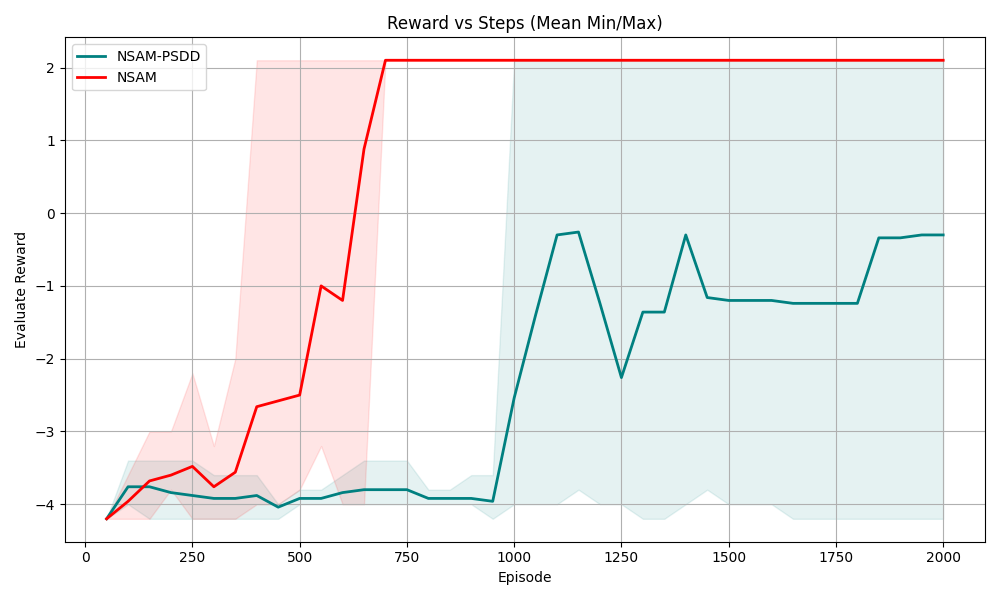
The image is a line graph comparing the performance of two algorithms, **NSAM-PSDD** (teal) and **NSAM** (red), over 2000 episodes. The y-axis represents the "Evaluated Reward" (ranging from -4 to 2), and the x-axis represents "Episode" (0 to 2000). Shaded regions indicate the minimum and maximum reward ranges for each algorithm.
### Components/Axes
- **Title**: "Reward vs Steps (Mean Min/Max)"
- **X-axis**: "Episode" (0 to 2000, linear scale)
- **Y-axis**: "Evaluated Reward" (-4 to 2, linear scale)
- **Legend**:
- **NSAM-PSDD**: Teal line with shaded teal region (top-left corner)
- **NSAM**: Red line with shaded red region (top-left corner)
- **Grid**: Light gray grid lines for reference.
### Detailed Analysis
1. **NSAM (Red Line)**:
- Starts at **-4** reward at episode 0.
- Sharp upward trend, reaching **2** reward by ~500 episodes.
- Remains flat at **2** reward for the remaining episodes (500–2000).
- Shaded red region (min/max) narrows significantly after episode 500, indicating reduced variability.
2. **NSAM-PSDD (Teal Line)**:
- Starts at **-4** reward at episode 0.
- Gradual improvement with fluctuations, peaking at **~0** reward around episode 1100.
- Dips to **~-2** reward at ~1250 episodes, then stabilizes near **-1** reward by ~1500 episodes.
- Sharp upward trend to **~-0.5** reward at ~1800 episodes, followed by minor fluctuations.
- Shaded teal region (min/max) remains broader than NSAM’s, especially in early episodes, but narrows slightly after episode 1500.
### Key Observations
- **NSAM** achieves a stable, maximum reward (**2**) much faster (~500 episodes) compared to **NSAM-PSDD**.
- **NSAM-PSDD** exhibits higher variability in early episodes but shows gradual improvement, surpassing NSAM’s performance by ~1800 episodes.
- Both algorithms’ shaded regions (min/max) indicate that **NSAM-PSDD** has greater uncertainty in rewards during early episodes, which decreases over time.
### Interpretation
- **NSAM** demonstrates rapid convergence to an optimal reward, suggesting it is more efficient or robust in this context. Its stability after episode 500 implies minimal exploration or adaptation is needed post-initial learning.
- **NSAM-PSDD**’s fluctuating performance indicates a trade-off between exploration and exploitation. The delayed stabilization (~1800 episodes) suggests it may be better suited for environments requiring adaptive learning or handling non-stationary rewards.
- The shaded regions highlight that **NSAM-PSDD**’s reward distribution is more dispersed initially, possibly due to exploratory behavior, which narrows as the algorithm refines its strategy.
### Spatial Grounding
- **Legend**: Top-left corner, clearly associating colors with algorithms.
- **Lines**: NSAM (red) and NSAM-PSDD (teal) occupy the central plot area, with shaded regions directly beneath each line.
- **Axes**: X-axis (episodes) spans the full width; Y-axis (reward) spans vertically, with grid lines aiding alignment.
### Content Details
- **NSAM**:
- Episode 0: Reward = -4
- Episode 500: Reward = 2 (plateau)
- **NSAM-PSDD**:
- Episode 1100: Reward ≈ 0 (peak)
- Episode 1800: Reward ≈ -0.5 (final stabilization)