## Bar Chart: Test Accuracy Comparison by BatchNorm Noise Augmentation
### Overview
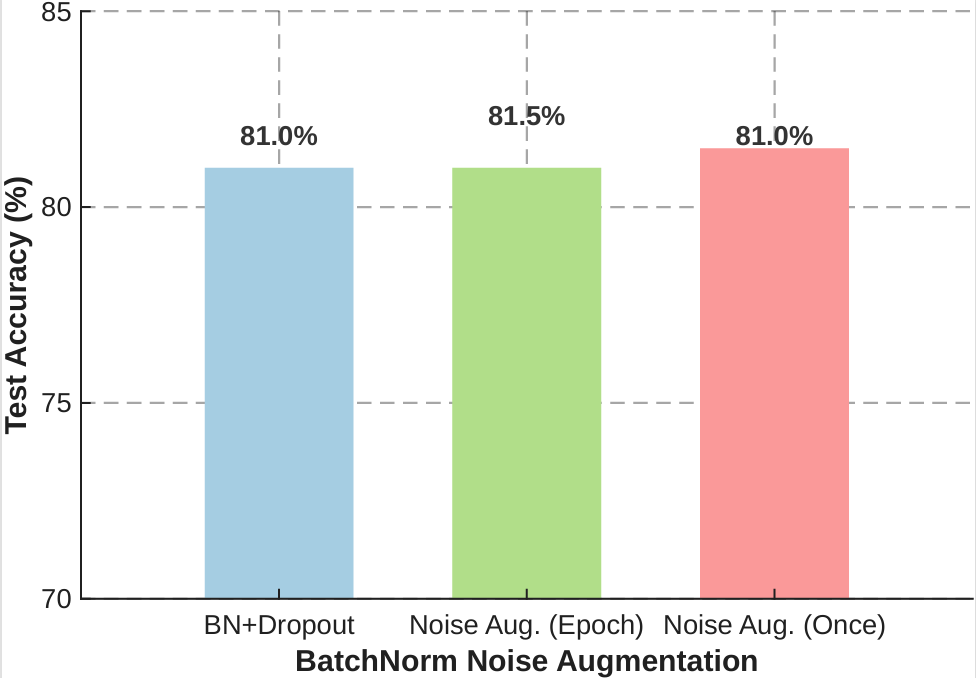
The image is a bar chart comparing the "Test Accuracy (%)" of a machine learning model across three distinct configurations of Batch Normalization (BN) and noise augmentation. The chart demonstrates that all three methods yield very similar performance results, with a marginal advantage for the "Noise Aug. (Epoch)" method.
### Components/Axes
* **Y-Axis (Vertical):** Labeled "Test Accuracy (%)". The scale ranges from 70 to 85, with major grid lines marked at 5-unit intervals (70, 75, 80, 85).
* **X-Axis (Horizontal):** Labeled "BatchNorm Noise Augmentation". It categorizes the three experimental conditions:
* **BN+Dropout** (Left)
* **Noise Aug. (Epoch)** (Center)
* **Noise Aug. (Once)** (Right)
* **Data Series (Bars):**
* **Left Bar:** Light blue color, representing "BN+Dropout".
* **Center Bar:** Light green color, representing "Noise Aug. (Epoch)".
* **Right Bar:** Light red/pink color, representing "Noise Aug. (Once)".
### Detailed Analysis
The chart displays the following specific data points for each category:
1. **BN+Dropout (Left):**
* **Visual Trend:** The bar is positioned on the left side of the chart.
* **Value:** The top of the bar aligns with the 81.0% mark.
2. **Noise Aug. (Epoch) (Center):**
* **Visual Trend:** The bar is positioned in the center. It is slightly taller than the other two bars.
* **Value:** The top of the bar aligns with the 81.5% mark.
3. **Noise Aug. (Once) (Right):**
* **Visual Trend:** The bar is positioned on the right side of the chart.
* **Value:** The top of the bar aligns with the 81.0% mark.
### Key Observations
* **Minimal Variance:** The total range of accuracy across all three methods is only 0.5% (from 81.0% to 81.5%).
* **Performance Parity:** "BN+Dropout" and "Noise Aug. (Once)" produce identical test accuracy results of 81.0%.
* **Visual Scaling:** The Y-axis is truncated, starting at 70 rather than 0. This visualization choice amplifies the visual height difference between the bars, making the 0.5% difference appear more significant than it is numerically.
### Interpretation
* **Data Significance:** The data suggests that the specific method of noise augmentation applied to Batch Normalization has a negligible impact on the final test accuracy of the model.
* **Practical Application:** While "Noise Aug. (Epoch)" is technically the superior method in this specific test, the gain is so small (0.5%) that it may not be statistically significant or practically relevant depending on the application.
* **Decision Making:** When choosing between these methods, a practitioner would likely prioritize factors other than accuracy, such as computational overhead, training time, or implementation complexity, as the performance delta is essentially non-existent. The chart serves to demonstrate that these variations are robust and yield consistent results.