## Flowchart Diagram: Multi-Stage Neural Network Architecture with MIL Integration
### Overview
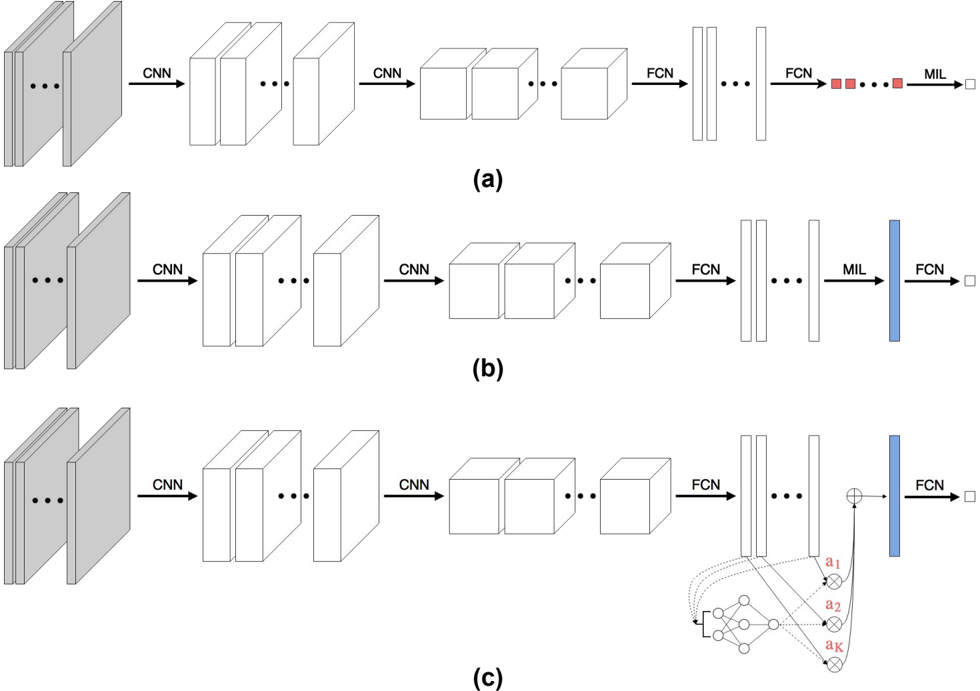
The diagram illustrates a three-stage neural network architecture with variations in the final processing steps. It is divided into three labeled sections (a), (b), and (c), each depicting incremental complexity in the Multi-Instance Learning (MIL) component. The flow progresses from input data through convolutional and fully connected layers to MIL-based processing, with distinct output configurations in each section.
### Components/Axes
- **Input**: Two gray rectangles labeled with ellipses (likely representing input data).
- **CNN**: Convolutional Neural Network blocks (repeated in all sections).
- **FCN**: Fully Connected Neural Network blocks (appears in all sections).
- **MIL**: Multi-Instance Learning component (varies across sections).
- **Output**: Final output blocks (red squares in (a), blue rectangle in (b), and a complex graph in (c)).
### Detailed Analysis
#### Section (a)
1. **Flow**: Input → CNN → CNN → CNN → FCN → FCN → MIL → Red squares (output).
2. **Key Elements**:
- MIL directly connects to red squares, suggesting a simplified output structure.
- No additional processing after MIL.
#### Section (b)
1. **Flow**: Input → CNN → CNN → CNN → FCN → FCN → MIL → Blue rectangle → FCN → Output.
2. **Key Elements**:
- MIL is followed by a blue rectangle (possibly an intermediate output) and a final FCN.
- Introduces post-MIL refinement via FCN.
#### Section (c)
1. **Flow**: Input → CNN → CNN → CNN → FCN → FCN → MIL → Complex graph → FCN → Output.
2. **Key Elements**:
- MIL integrates a graph-like structure with labeled nodes (a₁, a₂, ..., aₖ).
- The graph connects to FCN, indicating hierarchical feature integration.
- Final output retains the blue rectangle format from (b).
### Key Observations
- **Consistency**: All sections share the same initial pipeline (CNN → FCN → MIL).
- **Divergence**:
- (a) uses MIL as the terminal step.
- (b) adds a blue rectangle and FCN post-MIL.
- (c) introduces a graph-based MIL with labeled nodes, suggesting enhanced feature aggregation.
- **Color Coding**: Red squares (a), blue rectangle (b/c) likely denote output types or confidence scores.
### Interpretation
The diagram represents a progression in neural network design for tasks requiring multi-instance learning (e.g., medical imaging, document analysis).
- **Section (a)** reflects a baseline architecture where MIL directly produces outputs.
- **Section (b)** introduces post-MIL refinement, implying improved accuracy or interpretability.
- **Section (c)** incorporates a graph-based MIL, enabling dynamic feature weighting (nodes a₁–aₖ) for context-aware outputs. This suggests the architecture evolves from static to adaptive processing, optimizing for complex, instance-dependent tasks.
The use of distinct colors for outputs may indicate confidence levels or data modalities. The graph in (c) hints at attention mechanisms or graph neural networks (GNNs) for relational data modeling.