## Line Graph: Comparison of LM Trailing Loss Across Attention Mechanisms
### Overview
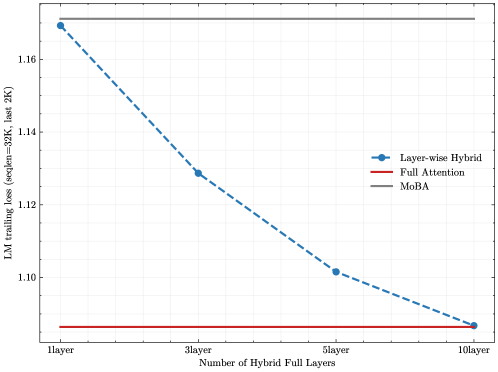
The image is a line graph comparing the performance of three different attention mechanisms in a language model, measured by trailing loss on a specific dataset. The graph plots loss against the number of hybrid full layers used in one of the methods.
### Components/Axes
* **Chart Type:** Line graph with markers.
* **X-Axis:**
* **Title:** "Number of Hybrid Full Layers"
* **Scale/Markers:** Categorical with four discrete points: "1layer", "3layer", "5layer", "10layer".
* **Y-Axis:**
* **Title:** "LM trailing loss (wepile-30K, last 2K)"
* **Scale:** Linear, ranging from approximately 1.08 to 1.18. Major tick marks are at 1.10, 1.12, 1.14, 1.16.
* **Legend:**
* **Placement:** Center-right of the plot area.
* **Series 1:** "Layer-wise Hybrid" - Represented by a blue dashed line with circular markers.
* **Series 2:** "Full Attention" - Represented by a solid red line.
* **Series 3:** "MoBA" - Represented by a solid gray line.
### Detailed Analysis
The graph displays three distinct data series:
1. **Layer-wise Hybrid (Blue Dashed Line):**
* **Trend:** Shows a clear, steep downward slope, indicating that loss decreases significantly as the number of hybrid full layers increases.
* **Data Points (Approximate):**
* At 1 layer: Loss ≈ 1.170
* At 3 layers: Loss ≈ 1.128
* At 5 layers: Loss ≈ 1.102
* At 10 layers: Loss ≈ 1.087
* **Spatial Grounding:** The line starts at the top-left of the plotted data and descends towards the bottom-right, converging with the red line at the 10-layer mark.
2. **Full Attention (Red Solid Line):**
* **Trend:** A perfectly horizontal line, indicating constant performance regardless of the "Number of Hybrid Full Layers" parameter (which likely does not apply to this baseline method).
* **Data Point (Approximate):** Constant loss ≈ 1.085 across all x-axis categories.
* **Spatial Grounding:** This line runs along the very bottom of the chart, serving as the performance baseline.
3. **MoBA (Gray Solid Line):**
* **Trend:** A perfectly horizontal line, indicating constant performance.
* **Data Point (Approximate):** Constant loss ≈ 1.170 across all x-axis categories.
* **Spatial Grounding:** This line runs along the very top of the chart, representing the highest (worst) loss value shown.
### Key Observations
* The "Layer-wise Hybrid" method's performance improves dramatically with more hybrid layers, moving from a loss value similar to "MoBA" at 1 layer to a value nearly matching "Full Attention" at 10 layers.
* "Full Attention" represents the lowest (best) loss on the chart, serving as a performance target.
* "MoBA" represents the highest (worst) loss and is unaffected by the hybrid layer parameter.
* The most significant performance gain for "Layer-wise Hybrid" occurs between 1 and 3 layers (a drop of ~0.042). The rate of improvement slows as more layers are added.
### Interpretation
This graph demonstrates the efficacy of the "Layer-wise Hybrid" attention mechanism. The data suggests that by increasing the number of full attention layers within a hybrid model, one can systematically reduce language modeling loss, approaching the performance of a full attention model. This is likely a trade-off between computational cost (full attention is expensive) and model performance.
The flat lines for "Full Attention" and "MoBA" indicate they are static baselines in this experiment. "Full Attention" is the gold standard for performance but is computationally intensive. "MoBA" (likely an acronym for a specific efficient attention method) performs poorly on this specific metric ("trailing loss on the last 2K tokens of wepile-30K"). The "Layer-wise Hybrid" approach offers a tunable middle ground, where performance can be scaled by allocating more resources (hybrid layers) to full attention computation. The convergence at 10 layers implies that with sufficient hybrid layers, the hybrid model can match full attention's quality on this task.