# Technical Data Extraction: Spectrogram Analysis
## 1. Image Classification and Overview
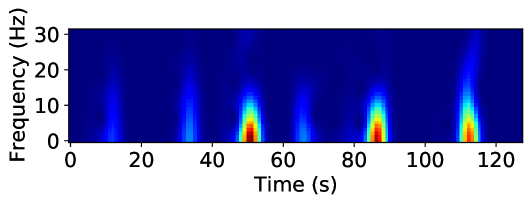
This image is a **spectrogram**, a heat-map style visualization representing the frequency spectrum of a signal as it varies with time. It displays signal intensity (magnitude) across different frequencies over a duration of approximately 125 seconds.
## 2. Component Isolation
### A. Axis Labels and Markers
* **Vertical Axis (Y-axis):**
* **Label:** `Frequency (Hz)`
* **Scale:** Linear, ranging from `0` to `30`.
* **Markers:** `0`, `10`, `20`, `30`.
* **Horizontal Axis (X-axis):**
* **Label:** `Time (s)`
* **Scale:** Linear, ranging from `0` to approximately `125`.
* **Markers:** `0`, `20`, `40`, `60`, `80`, `100`, `120`.
### B. Color Scale (Implicit Legend)
While a numerical color bar is not present, the image uses a standard "Jet" or "Rainbow" colormap:
* **Dark Blue:** Background/Baseline (Zero or low intensity).
* **Light Blue/Cyan:** Low-to-mid intensity.
* **Yellow/Orange:** High intensity.
* **Dark Red:** Peak intensity.
---
## 3. Data Extraction and Trend Analysis
The chart displays a series of discrete "bursts" or events of signal activity. The background remains a consistent dark blue (low energy) across all frequencies.
### Event Analysis (Temporal and Spectral Placement)
There are six distinct vertical features (bursts) identified. Each burst starts at 0 Hz and extends upward, with the highest energy concentrated at the lowest frequencies.
| Event # | Approx. Time (s) | Peak Intensity Color | Frequency Range of Peak (Red) | Vertical Extent (Visible Blue) |
| :--- | :--- | :--- | :--- | :--- |
| 1 | ~12s | Light Blue | N/A (Low intensity) | 0 - 15 Hz |
| 2 | ~34s | Cyan/Light Blue | N/A (Low intensity) | 0 - 20 Hz |
| 3 | ~51s | **Dark Red** | 0 - 5 Hz | 0 - 30 Hz (Faint tail to top) |
| 4 | ~66s | Light Blue | N/A (Low intensity) | 0 - 15 Hz |
| 5 | ~87s | **Dark Red** | 0 - 5 Hz | 0 - 20 Hz |
| 6 | ~113s | **Dark Red** | 0 - 5 Hz | 0 - 30 Hz (Faint tail to top) |
### Key Trends:
1. **Frequency Concentration:** The signal energy is heavily concentrated in the low-frequency band (0 Hz to 10 Hz).
2. **Periodic/Intermittent Nature:** The events are non-continuous. The spacing between major high-intensity bursts (Events 3, 5, and 6) is roughly 36 seconds and 26 seconds respectively, suggesting an irregular or quasi-periodic signal.
3. **Spectral Leakage/Harmonics:** The high-intensity bursts (Red) at ~51s and ~113s show vertical "tails" that reach the 30 Hz limit, indicating a broadband impulse or a signal with significant harmonic content at those specific moments.
4. **Intensity Variation:** The intensity of the events is not uniform; the events at 51s, 87s, and 113s are significantly more powerful than the events at 12s, 34s, and 66s.
---
## 4. Summary of Facts
* **Signal Type:** Time-varying frequency data (Spectrogram).
* **Total Duration:** ~125 seconds.
* **Frequency Bandwidth:** 0 - 30 Hz.
* **Primary Data Points:** Six discrete impulses.
* **Dominant Frequency:** < 5 Hz (where the red intensity is highest).
* **Language:** English (Labels: "Frequency (Hz)", "Time (s)").