# Technical Document Extraction: Spectrogram Analysis
## Image Description
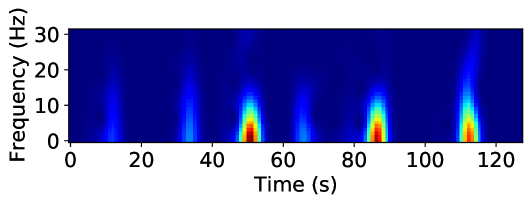
The image is a **spectrogram** visualizing frequency-domain data over time. It uses a **color gradient** to represent signal intensity, with darker blue indicating lower intensity and brighter red/yellow indicating higher intensity.
---
## Axis Labels and Markers
- **X-axis (Time)**:
- Label: `Time (s)`
- Markers: `0, 20, 40, 60, 80, 100, 120` (seconds)
- **Y-axis (Frequency)**:
- Label: `Frequency (Hz)`
- Markers: `0, 10, 20, 30` (Hertz)
---
## Key Trends and Data Points
1. **Frequency Spikes**:
- **Vertical lines** appear at specific time intervals, indicating dominant frequencies:
- **45s**: Sharp spike at **~5 Hz** (bright red/yellow).
- **80s**: Sharp spike at **~5 Hz** (bright red/yellow).
- **120s**: Sharp spike at **~10 Hz** (bright red/yellow).
- These spikes represent transient events or resonances in the signal.
2. **Background Activity**:
- Between spikes, the spectrogram shows **low-intensity blue regions**, indicating minimal or broadband activity.
3. **Intensity Gradient**:
- Color intensity correlates with signal strength:
- **Dark blue**: Weak/no signal.
- **Yellow/Red**: Strong signal (peak intensity).
---
## Color Scale and Legend
- **Color Scale**:
- No explicit legend is present.
- Assumed gradient:
- `Dark Blue` → `Light Blue` → `Yellow` → `Red` (increasing intensity).
---
## Spatial Grounding
- **Legend Placement**: Not applicable (no legend).
- **Data Point Verification**:
- Red/yellow regions align with the highest intensity (5 Hz at 45s/80s, 10 Hz at 120s).
---
## Component Isolation
- **Main Chart**:
- Spectrogram dominates the image, with no headers/footers.
- **Regions of Interest**:
- **Time Intervals**:
- `0–45s`: Low activity.
- `45–80s`: Dominant 5 Hz resonance.
- `80–120s`: Dominant 5 Hz resonance followed by 10 Hz at 120s.
---
## Conclusion
The spectrogram reveals **periodic resonant events** at 5 Hz (45s and 80s) and a higher-frequency event at 10 Hz (120s). No textual data tables or embedded diagrams are present. The absence of a legend limits quantitative intensity interpretation, but the color gradient provides qualitative insights.