## Bar Chart: Mean Jaccard Similarity by Routing Method
### Overview
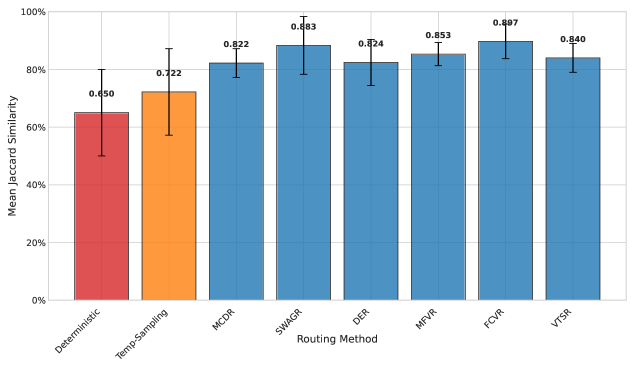
The image is a bar chart comparing the mean Jaccard similarity for different routing methods. The chart displays the similarity scores as percentages on the y-axis and the routing methods on the x-axis. Error bars are included on each bar to indicate variability.
### Components/Axes
* **Title:** There is no explicit title on the chart.
* **X-axis:**
* **Label:** Routing Method
* **Categories:** Deterministic, Temp-Sampling, MCDR, SWAGR, DER, MFVR, FCVR, VTSR
* **Y-axis:**
* **Label:** Mean Jaccard Similarity
* **Scale:** 0% to 100% in increments of 20%
* **Bars:** Each bar represents a routing method. The height of the bar corresponds to the mean Jaccard similarity.
* Deterministic (Red)
* Temp-Sampling (Orange)
* MCDR (Blue)
* SWAGR (Blue)
* DER (Blue)
* MFVR (Blue)
* FCVR (Blue)
* VTSR (Blue)
* **Error Bars:** Vertical lines extending above and below each bar, indicating the range of variability.
### Detailed Analysis
Here's a breakdown of the mean Jaccard similarity for each routing method:
* **Deterministic:** 0.650 (65%) with error bars extending approximately from 50% to 80%.
* **Temp-Sampling:** 0.722 (72.2%) with error bars extending approximately from 57% to 87%.
* **MCDR:** 0.822 (82.2%) with error bars extending approximately from 78% to 86%.
* **SWAGR:** 0.883 (88.3%) with error bars extending approximately from 84% to 92%.
* **DER:** 0.824 (82.4%) with error bars extending approximately from 78% to 86%.
* **MFVR:** 0.853 (85.3%) with error bars extending approximately from 81% to 89%.
* **FCVR:** 0.897 (89.7%) with error bars extending approximately from 86% to 94%.
* **VTSR:** 0.840 (84.0%) with error bars extending approximately from 80% to 88%.
### Key Observations
* The Deterministic routing method has the lowest mean Jaccard similarity (65%), while FCVR has the highest (89.7%).
* The error bars for Deterministic and Temp-Sampling are larger than those for the other methods, indicating greater variability in their similarity scores.
* MCDR, SWAGR, DER, MFVR, FCVR, and VTSR all have relatively high and similar mean Jaccard similarity scores, ranging from approximately 82% to 90%.
### Interpretation
The bar chart suggests that the routing methods MCDR, SWAGR, DER, MFVR, FCVR, and VTSR are more effective in terms of Jaccard similarity compared to Deterministic and Temp-Sampling. The larger error bars for Deterministic and Temp-Sampling indicate that their performance is less consistent. The FCVR routing method appears to be the most effective among those tested, as it has the highest mean Jaccard similarity.