\n
## Bar Chart: Mean Jaccard Similarity by Routing Method
### Overview
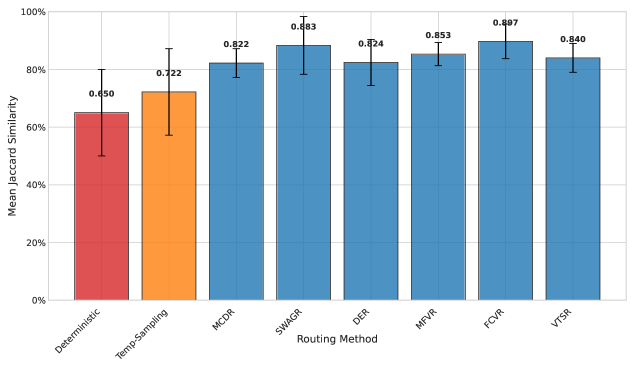
The image is a vertical bar chart comparing the performance of eight different "Routing Methods" based on a metric called "Mean Jaccard Similarity." The chart includes error bars for each method, indicating variability or confidence intervals around the mean values.
### Components/Axes
* **Y-Axis (Vertical):**
* **Label:** "Mean Jaccard Similarity"
* **Scale:** Percentage scale from 0% to 100%, with major tick marks at 20% intervals (0%, 20%, 40%, 60%, 80%, 100%).
* **X-Axis (Horizontal):**
* **Label:** "Routing Method"
* **Categories (from left to right):**
1. Deterministic
2. Temp-Sampling
3. MCDR
4. SWAGR
5. DER
6. MFPR
7. fCVR
8. VTSR
* **Data Series:** Each routing method is represented by a single bar. The bars are colored distinctly, though no separate legend is provided; the color is tied directly to the x-axis label.
* **Deterministic:** Red bar.
* **Temp-Sampling:** Orange bar.
* **MCDR, SWAGR, DER, MFPR, fCVR, VTSR:** Various shades of blue bars.
* **Error Bars:** Each bar has a black, vertical error bar extending above and below the top of the bar, indicating the range of uncertainty or variance for that measurement.
### Detailed Analysis
The mean Jaccard Similarity values, as annotated on top of each bar, are as follows:
1. **Deterministic (Red Bar, far left):** 0.650 (65.0%). Error bar extends from approximately 0.50 to 0.80.
2. **Temp-Sampling (Orange Bar, second from left):** 0.722 (72.2%). Error bar extends from approximately 0.58 to 0.87.
3. **MCDR (Blue Bar):** 0.822 (82.2%). Error bar extends from approximately 0.78 to 0.87.
4. **SWAGR (Blue Bar):** 0.883 (88.3%). Error bar extends from approximately 0.79 to 0.98.
5. **DER (Blue Bar):** 0.824 (82.4%). Error bar extends from approximately 0.75 to 0.90.
6. **MFPR (Blue Bar):** 0.853 (85.3%). Error bar extends from approximately 0.80 to 0.91.
7. **fCVR (Blue Bar):** 0.897 (89.7%). Error bar extends from approximately 0.85 to 0.95.
8. **VTSR (Blue Bar, far right):** 0.840 (84.0%). Error bar extends from approximately 0.80 to 0.88.
**Visual Trend:** The chart shows a general upward trend in mean Jaccard Similarity from left to right. The first two methods (Deterministic, Temp-Sampling) are notably lower than the subsequent six methods, which all cluster above 80%. The highest value is for fCVR (0.897), closely followed by SWAGR (0.883).
### Key Observations
* **Performance Grouping:** There is a clear performance gap. The "Deterministic" and "Temp-Sampling" methods form a lower-performing group (65-72%). The other six methods (MCDR, SWAGR, DER, MFPR, fCVR, VTSR) form a higher-performing group (82-90%).
* **Highest Performer:** The **fCVR** method achieves the highest mean Jaccard Similarity at 0.897.
* **Variability:** The error bars for "Deterministic" and "Temp-Sampling" are relatively large, suggesting higher variance or less certainty in their mean scores. The error bars for the higher-performing blue bars are generally tighter, with SWAGR showing a particularly wide range (extending near 100%).
* **Color Coding:** The use of distinct colors (red, orange, blue) for the first two bars versus the rest visually reinforces the performance grouping observed in the data.
### Interpretation
This chart likely evaluates different algorithmic strategies ("Routing Methods") for a task where set similarity (measured by the Jaccard index) is the key performance metric. The Jaccard Similarity quantifies how similar two sets are, often used in machine learning for tasks like evaluating recommendation systems, clustering, or information retrieval.
The data suggests that more sophisticated or probabilistic routing methods (the blue group: MCDR, SWAGR, etc.) significantly outperform simpler baselines like "Deterministic" routing. The "fCVR" and "SWAGR" methods appear to be the most effective according to this metric. The large error bar for SWAGR indicates that while its average performance is excellent, its results may be less consistent than methods like fCVR or MFPR.
From a Peircean perspective, the chart uses visual signs (bar height as an icon of magnitude, color as a symbol of category) to indexically point to a conclusion: advanced routing methods yield higher set similarity. The investigation reveals that the choice of routing method is a critical factor for system performance, with a clear hierarchy of effectiveness demonstrated by the quantitative data. The clustering of results above 80% for most methods may indicate a performance plateau or a common underlying challenge in the task being measured.