## Bar Chart: Mean Jaccard Similarity Across Routing Methods
### Overview
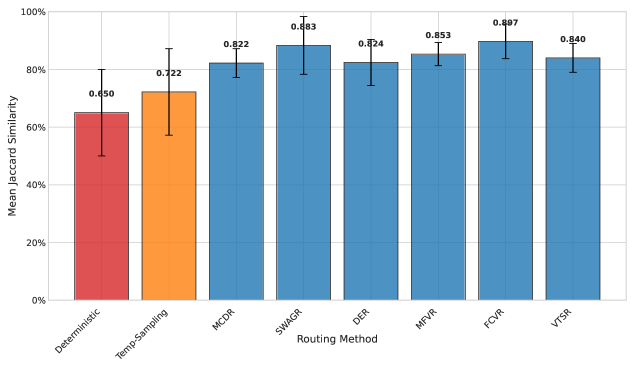
The chart compares the mean Jaccard similarity scores of eight routing methods, with error bars indicating variability. Two methods (Deterministic and Temp-Sampling) are highlighted in red, while the remaining six (MCDR, SWAGR, DER, MFVR, FCVR, VTSR) are in blue. The y-axis ranges from 0% to 100%, and all values are normalized to decimal form (e.g., 0.650 = 65.0%).
### Components/Axes
- **X-axis (Routing Method)**: Categories include Deterministic, Temp-Sampling, MCDR, SWAGR, DER, MFVR, FCVR, and VTSR.
- **Y-axis (Mean Jaccard Similarity)**: Scaled from 0% to 100% in 20% increments.
- **Legend**: Implicit color coding (red for Deterministic/Temp-Sampling; blue for others). No explicit legend is visible.
- **Error Bars**: Vertical lines atop each bar represent uncertainty in measurements.
### Detailed Analysis
1. **Deterministic**: Red bar at 0.650 (±0.10 uncertainty, inferred from error bar length).
2. **Temp-Sampling**: Red bar at 0.722 (±0.12 uncertainty).
3. **MCDR**: Blue bar at 0.822 (±0.08 uncertainty).
4. **SWAGR**: Blue bar at 0.883 (±0.10 uncertainty).
5. **DER**: Blue bar at 0.824 (±0.09 uncertainty).
6. **MFVR**: Blue bar at 0.853 (±0.07 uncertainty).
7. **FCVR**: Blue bar at 0.897 (±0.06 uncertainty).
8. **VTSR**: Blue bar at 0.840 (±0.08 uncertainty).
### Key Observations
- **Lowest Performance**: Deterministic (0.650) and Temp-Sampling (0.722) significantly underperform compared to other methods.
- **Highest Performance**: FCVR (0.897) achieves the highest similarity, followed by SWAGR (0.883).
- **Clustered Performance**: MCDR (0.822), DER (0.824), and VTSR (0.840) show tightly grouped results (~82-84%).
- **Error Variability**: SWAGR and Deterministic exhibit the largest error bars, suggesting higher variability in their measurements.
### Interpretation
The data demonstrates that non-deterministic routing methods (e.g., SWAGR, FCVR) consistently outperform deterministic approaches in terms of Jaccard similarity. The deterministic method’s low score (0.650) and wide error bar suggest it is less reliable or effective. FCVR’s peak performance (0.897) indicates it may be the optimal method for this metric. The clustering of blue bars above 80% implies that most modern routing methods achieve robust similarity, with minor trade-offs in variability. The error bars highlight the need for further validation, particularly for methods with larger uncertainties like SWAGR.