## Error Bar Chart: Ratios of Pareto Front Size for Solving OneMinMax (n=200)
### Overview
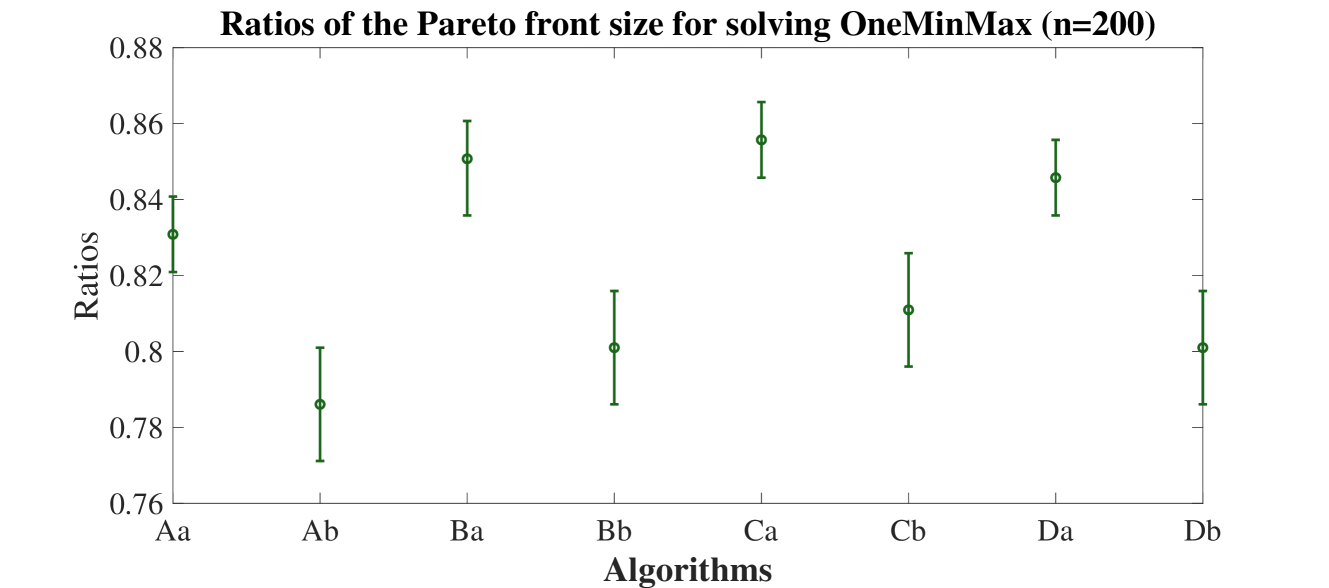
The image is an error bar chart comparing the ratios of the Pareto front size for different algorithms solving the OneMinMax problem with n=200. The chart displays the mean ratio for each algorithm along with error bars indicating the variability or uncertainty associated with each mean.
### Components/Axes
* **Title:** Ratios of the Pareto front size for solving OneMinMax (n=200)
* **X-axis:** Algorithms, labeled with algorithm names: Aa, Ab, Ba, Bb, Ca, Cb, Da, Db.
* **Y-axis:** Ratios, ranging from 0.76 to 0.88 with increments of 0.02.
* **Data:** Each algorithm has a data point representing the mean ratio, with error bars extending above and below the mean. All data points and error bars are green.
### Detailed Analysis
Here's a breakdown of the approximate mean ratios and error bar ranges for each algorithm:
* **Aa:** Mean ratio ~0.83, error bar range ~0.82 to ~0.84
* **Ab:** Mean ratio ~0.79, error bar range ~0.77 to ~0.81
* **Ba:** Mean ratio ~0.85, error bar range ~0.84 to ~0.86
* **Bb:** Mean ratio ~0.80, error bar range ~0.79 to ~0.82
* **Ca:** Mean ratio ~0.86, error bar range ~0.85 to ~0.87
* **Cb:** Mean ratio ~0.81, error bar range ~0.80 to ~0.83
* **Da:** Mean ratio ~0.85, error bar range ~0.84 to ~0.86
* **Db:** Mean ratio ~0.80, error bar range ~0.79 to ~0.82
### Key Observations
* Algorithm Ca has the highest mean ratio, approximately 0.86.
* Algorithm Ab has the lowest mean ratio, approximately 0.79.
* Algorithms Ba and Da have similar mean ratios, both around 0.85.
* Algorithms Bb and Db have similar mean ratios, both around 0.80.
* The error bars vary in length, indicating different levels of variability in the ratios for each algorithm.
### Interpretation
The chart provides a comparison of the performance of different algorithms in terms of the Pareto front size ratio when solving the OneMinMax problem. A higher ratio generally indicates a better performance in terms of the size of the Pareto front. The error bars provide an indication of the consistency of each algorithm's performance. Algorithms with shorter error bars are more consistent in their performance, while those with longer error bars exhibit greater variability. Algorithm Ca appears to be the most effective, while Algorithm Ab appears to be the least effective based on this metric. The similarity in performance between Ba/Da and Bb/Db suggests potential groupings or similarities in their underlying mechanisms.