\n
## Chart: Ratios of the Pareto front size for solving OneMinMax (n=200)
### Overview
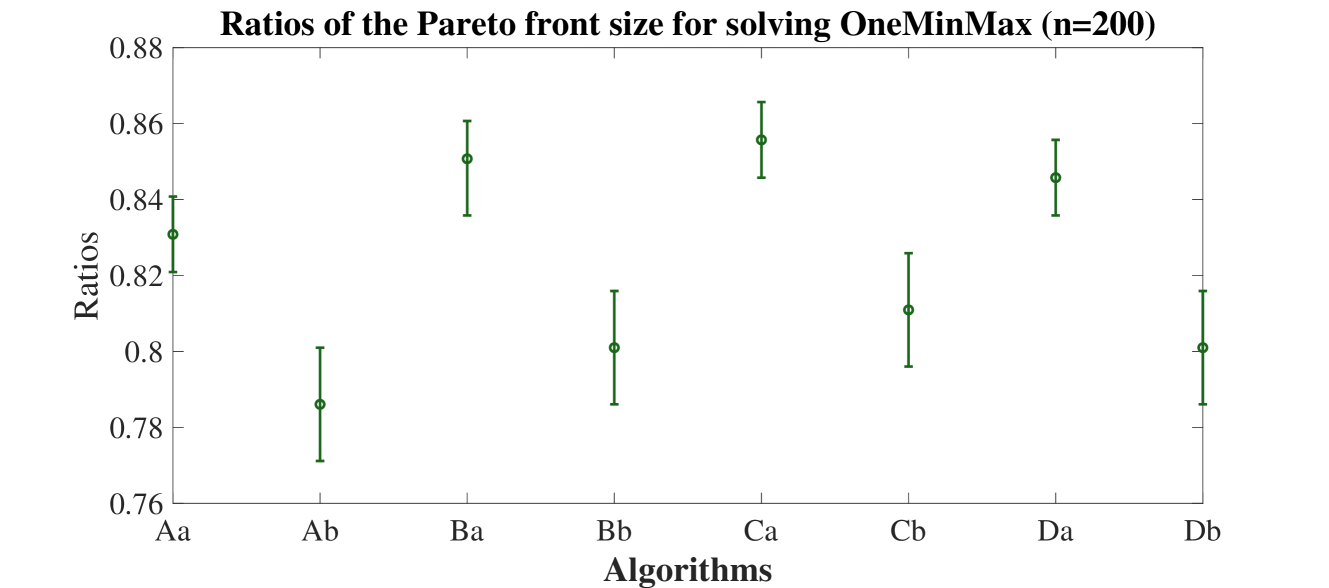
The image presents a chart displaying the ratios of the Pareto front size for solving the OneMinMax problem with a sample size of n=200. The chart uses error bars to represent the variability of the ratios for different algorithms.
### Components/Axes
* **Title:** "Ratios of the Pareto front size for solving OneMinMax (n=200)" - positioned at the top-center of the chart.
* **X-axis:** "Algorithms" - labels are Aa, Ab, Ba, Bb, Ca, Cb, Da, and Db. These are evenly spaced along the horizontal axis.
* **Y-axis:** "Ratios" - scale ranges from approximately 0.76 to 0.88, with tick marks at 0.78, 0.80, 0.82, 0.84, 0.86.
* **Data Series:** A single data series represented by points with error bars. The points are connected implicitly by the visual arrangement.
* **Error Bars:** Vertical lines extending above and below each data point, indicating the range of variability.
### Detailed Analysis
The chart displays the ratios for eight different algorithms (Aa through Db). The trend is generally around 0.82, with some variation.
* **Aa:** Ratio is approximately 0.825, with an error bar extending from approximately 0.815 to 0.835.
* **Ab:** Ratio is approximately 0.795, with an error bar extending from approximately 0.775 to 0.815.
* **Ba:** Ratio is approximately 0.855, with an error bar extending from approximately 0.835 to 0.875.
* **Bb:** Ratio is approximately 0.805, with an error bar extending from approximately 0.785 to 0.825.
* **Ca:** Ratio is approximately 0.86, with an error bar extending from approximately 0.84 to 0.88.
* **Cb:** Ratio is approximately 0.825, with an error bar extending from approximately 0.805 to 0.845.
* **Da:** Ratio is approximately 0.845, with an error bar extending from approximately 0.825 to 0.865.
* **Db:** Ratio is approximately 0.80, with an error bar extending from approximately 0.78 to 0.82.
### Key Observations
* Algorithm Ba and Ca exhibit the highest ratios, suggesting they perform best in terms of Pareto front size.
* Algorithms Ab and Db have the lowest ratios.
* The error bars indicate that the variability is relatively consistent across the algorithms, although Ba and Ca have slightly larger error bars.
* There is no clear upward or downward trend across the algorithms.
### Interpretation
The chart compares the performance of eight different algorithms in solving the OneMinMax problem, as measured by the ratio of the Pareto front size. A higher ratio indicates a better algorithm, as it suggests a larger and more diverse set of non-dominated solutions.
Algorithms Ba and Ca consistently show the highest ratios, suggesting they are the most effective algorithms for this problem. Algorithms Ab and Db show the lowest ratios, indicating they may be less effective. The error bars provide a measure of the uncertainty in these estimates, and it is important to consider these when interpreting the results.
The lack of a clear trend suggests that the performance of the algorithms is not simply a function of their order (Aa, Ab, Ba, etc.). The differences in performance are likely due to the specific characteristics of each algorithm and how they interact with the OneMinMax problem. The sample size of n=200 is noted in the title, which suggests that the results may be specific to this sample size and may not generalize to other sample sizes.