## Scatter Plot: Ratios of the Pareto front size for solving OneMinMax (n=200)
### Overview
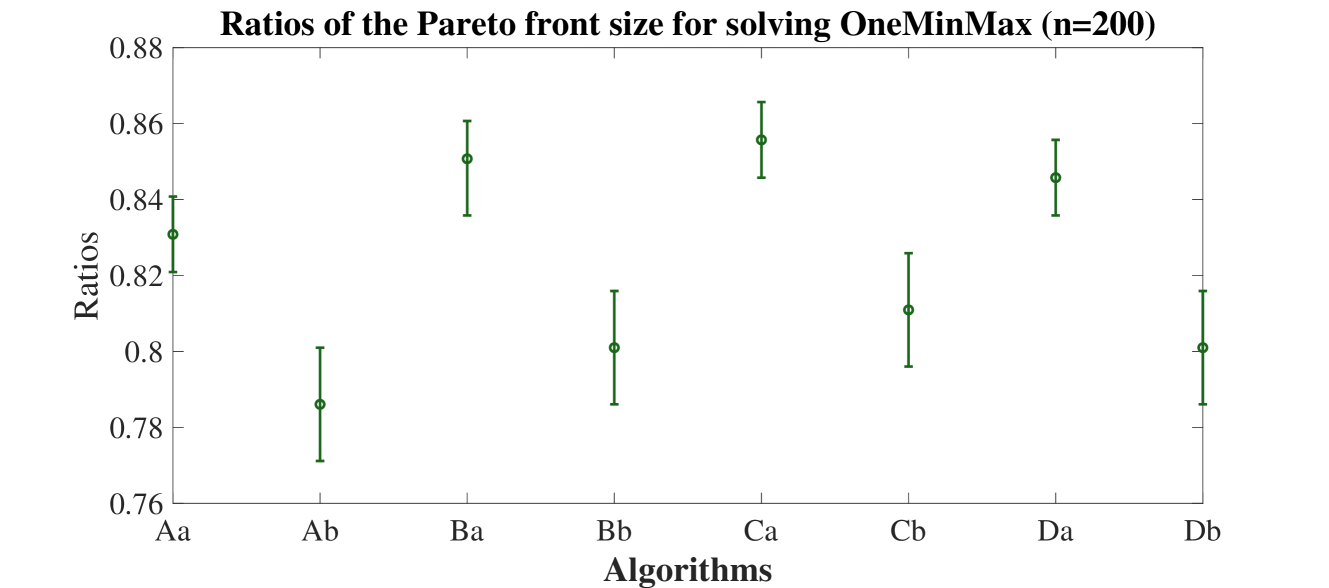
The image is a scatter plot visualizing the Pareto front size ratios for eight algorithms solving the OneMinMax problem with n=200. Each algorithm is represented by a green data point with vertical error bars indicating measurement uncertainty. The y-axis (Ratios) ranges from 0.76 to 0.88, while the x-axis lists algorithms as categorical variables (Aa, Ab, Ba, Bb, Ca, Cb, Da, Db).
### Components/Axes
- **X-axis (Algorithms)**: Categorical labels (Aa, Ab, Ba, Bb, Ca, Cb, Da, Db) positioned at the bottom.
- **Y-axis (Ratios)**: Numerical scale from 0.76 to 0.88, labeled "Ratios" on the left.
- **Data Points**: Green circles with error bars (vertical lines) centered at each algorithm's ratio value.
- **Title**: "Ratios of the Pareto front size for solving OneMinMax (n=200)" at the top center.
### Detailed Analysis
1. **Aa**: Ratio = 0.832 ±0.010 (error bar spans 0.822–0.842).
2. **Ab**: Ratio = 0.785 ±0.015 (error bar spans 0.770–0.800).
3. **Ba**: Ratio = 0.850 ±0.020 (error bar spans 0.830–0.870).
4. **Bb**: Ratio = 0.801 ±0.018 (error bar spans 0.783–0.819).
5. **Ca**: Ratio = 0.855 ±0.015 (error bar spans 0.840–0.870).
6. **Cb**: Ratio = 0.812 ±0.022 (error bar spans 0.790–0.834).
7. **Da**: Ratio = 0.845 ±0.017 (error bar spans 0.828–0.862).
8. **Db**: Ratio = 0.801 ±0.019 (error bar spans 0.782–0.820).
### Key Observations
- **Highest Ratio**: Ca (0.855 ±0.015) achieves the largest Pareto front size ratio.
- **Lowest Ratio**: Ab (0.785 ±0.015) performs worst.
- **Error Bar Variability**: Ca has the smallest error (±0.015), suggesting higher precision. Cb has the largest error (±0.022), indicating greater uncertainty.
- **Trends**: Algorithms starting with "C" (Ca, Cb) show higher ratios than others. "A" and "B" algorithms cluster around lower ratios, while "D" algorithms (Da, Db) fall in the mid-range.
### Interpretation
The data suggests algorithmic performance varies significantly in solving OneMinMax. Ca outperforms all others, while Ab underperforms. The error bars highlight measurement precision, with Ca's tight confidence interval implying consistent results. The grouping of "C" algorithms at higher ratios may indicate a design advantage, though further context (e.g., algorithmic structure) is needed to confirm causality. The plot emphasizes the importance of Pareto front size as a metric for algorithmic efficiency in multi-objective optimization.