# Technical Document Extraction: Attention over Values (a=12)
## Chart Overview
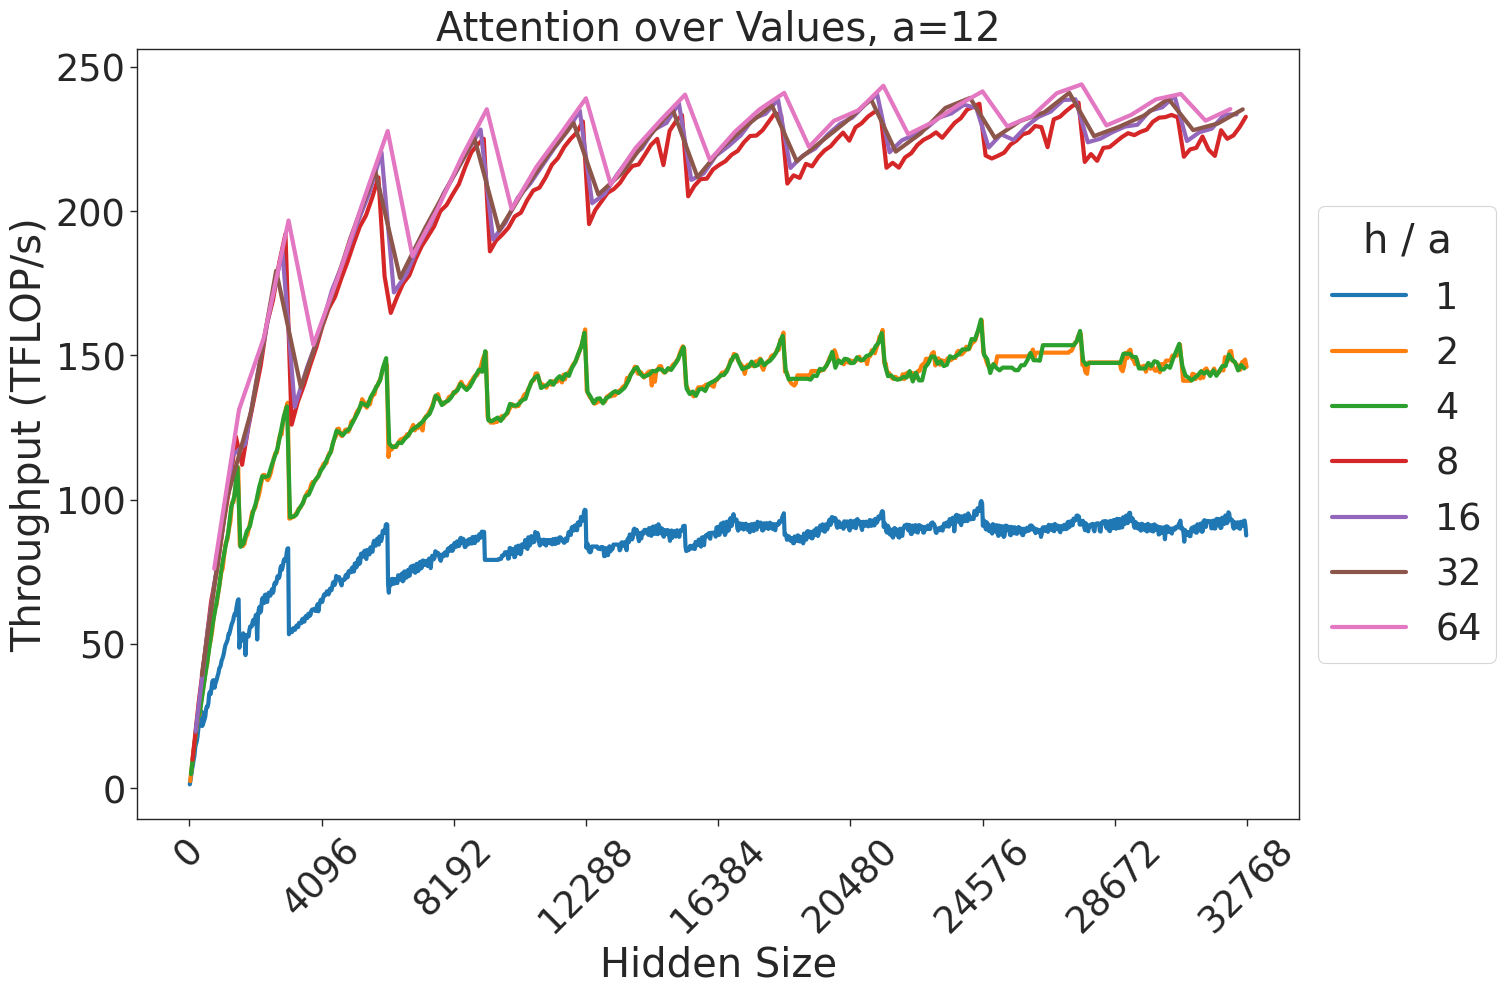
- **Title**: Attention over Values, a=12
- **Type**: Line graph
- **Purpose**: Visualizes throughput (TFLOPs/s) across varying hidden sizes for different h/a ratios
## Axes
- **X-axis (Horizontal)**:
- Label: `Hidden Size`
- Range: `0` to `32768`
- Tick Intervals: `0`, `4096`, `8192`, `12288`, `16384`, `20480`, `24576`, `28672`, `32768`
- **Y-axis (Vertical)**:
- Label: `Throughput (TFLOPs/s)`
- Range: `0` to `250`
- Tick Intervals: `0`, `50`, `100`, `150`, `200`, `250`
## Legend
- **Location**: Right side of the chart
- **Labels and Colors**:
- `h/a = 1` → Blue
- `h/a = 2` → Orange
- `h/a = 4` → Green
- `h/a = 8` → Red
- `h/a = 16` → Purple
- `h/a = 32` → Brown
- `h/a = 64` → Pink
## Data Series Analysis
1. **h/a = 1 (Blue)**:
- **Trend**: Gradual upward slope with minor fluctuations.
- **Key Points**:
- At `Hidden Size = 0`: ~0 TFLOPs/s
- At `Hidden Size = 32768`: ~90 TFLOPs/s
2. **h/a = 2 (Orange)**:
- **Trend**: Slightly higher than h/a=1, with similar growth pattern.
- **Key Points**:
- At `Hidden Size = 0`: ~0 TFLOPs/s
- At `Hidden Size = 32768`: ~140 TFLOPs/s
3. **h/a = 4 (Green)**:
- **Trend**: Moderate fluctuations but steeper growth than h/a=2.
- **Key Points**:
- At `Hidden Size = 0`: ~0 TFLOPs/s
- At `Hidden Size = 32768`: ~150 TFLOPs/s
4. **h/a = 8 (Red)**:
- **Trend**: Highest throughput, with sharp initial growth and sustained performance.
- **Key Points**:
- At `Hidden Size = 0`: ~0 TFLOPs/s
- At `Hidden Size = 32768`: ~230 TFLOPs/s
5. **h/a = 16 (Purple)**:
- **Trend**: Overlaps with h/a=32 and h/a=64; minimal fluctuations.
- **Key Points**:
- At `Hidden Size = 0`: ~0 TFLOPs/s
- At `Hidden Size = 32768`: ~240 TFLOPs/s
6. **h/a = 32 (Brown)**:
- **Trend**: Nearly identical to h/a=16 and h/a=64.
- **Key Points**:
- At `Hidden Size = 0`: ~0 TFLOPs/s
- At `Hidden Size = 32768`: ~240 TFLOPs/s
7. **h/a = 64 (Pink)**:
- **Trend**: Overlaps with h/a=16 and h/a=32; highest throughput.
- **Key Points**:
- At `Hidden Size = 0`: ~0 TFLOPs/s
- At `Hidden Size = 32768`: ~240 TFLOPs/s
## Key Observations
- **Diminishing Returns**: Higher h/a ratios (e.g., 16, 32, 64) achieve similar throughput (~240 TFLOPs/s) despite exponential increases in h/a.
- **Scalability**: Throughput increases with hidden size for all h/a ratios, but the rate of growth slows after `Hidden Size = 8192`.
- **Performance Threshold**: h/a=8 (red) achieves ~230 TFLOPs/s, while h/a=16/32/64 plateau near ~240 TFLOPs/s.
## Spatial Grounding
- **Legend Position**: Right-aligned, outside the plot area.
- **Color Consistency**: All lines match their legend labels (e.g., red = h/a=8).
## Language Notes
- **Primary Language**: English
- **No Additional Languages Detected**
## Conclusion
The chart demonstrates that higher h/a ratios correlate with increased throughput, but beyond h/a=8, performance gains plateau. This suggests an optimal h/a ratio for maximizing throughput in this context.