## Line Chart: Model Performance vs Efficiency (OPT-6.7B)
### Overview
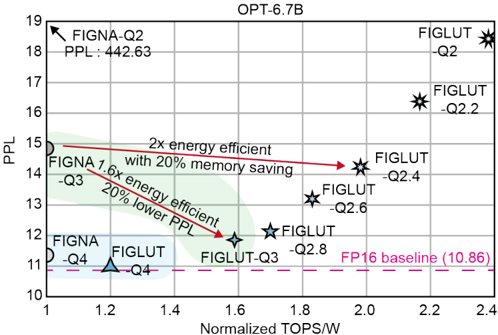
The chart compares the performance (PPL) and energy efficiency (Normalized TOPS/W) of various AI models (FIGNA and FIGLUT variants) against a FP16 baseline. It highlights trade-offs between computational efficiency and model quality, with annotations indicating energy savings and memory optimizations.
### Components/Axes
- **X-axis**: Normalized TOPS/W (1.0 to 2.4)
- Ticks at 1.0, 1.2, 1.4, 1.6, 1.8, 2.0, 2.2, 2.4
- **Y-axis**: PPL (10 to 19)
- Ticks at 10, 11, 12, 13, 14, 15, 16, 17, 18, 19
- **Legend**:
- Green circle: FIGNA
- Blue star: FIGLUT
- **Annotations**:
- Red arrows indicating "2x energy efficient with 20% memory saving" and "20% lower PPL"
- Dashed pink line labeled "FP16 baseline (10.86)"
### Detailed Analysis
1. **Data Points**:
- **FIGNA-Q2**: (1.1, 18) with PPL 442.63 (top-left, highest PPL)
- **FIGNA-Q3**: (1.3, 14) with 20% lower PPL than baseline
- **FIGNA-Q4**: (1.2, 11) in shaded green region (20% energy efficient)
- **FIGLUT-Q2.8**: (1.7, 13) near FP16 baseline
- **FIGLUT-Q2.4**: (1.9, 14) in shaded blue region (20% memory saving)
- **FIGLUT-Q2.6**: (1.8, 13)
- **FIGLUT-Q2.2**: (2.1, 17)
2. **Trends**:
- **Energy Efficiency**: Models in green (FIGNA) and blue (FIGLUT) shaded regions show 20% energy savings.
- **PPL vs Efficiency**: Higher TOPS/W (right side) correlates with lower PPL (bottom), but trade-offs exist (e.g., FIGLUT-Q2.2 has high TOPS/W but poor PPL).
- **Baseline Comparison**: All models except FP16 baseline (dashed line) have higher PPL.
### Key Observations
- **Outliers**:
- FIGNA-Q2 has the highest PPL (18) but lowest TOPS/W (1.1), indicating poor efficiency.
- FIGLUT-Q2.2 has the highest TOPS/W (2.1) but poor PPL (17), suggesting suboptimal performance.
- **Efficiency-Performance Trade-off**:
- Models like FIGLUT-Q2.8 (1.7 TOPS/W, 13 PPL) balance efficiency and performance better than others.
- Shaded regions highlight energy-efficient models but do not guarantee optimal PPL.
### Interpretation
The chart demonstrates that optimizing for energy efficiency (via lower TOPS/W) often reduces PPL, but some models (e.g., FIGLUT-Q2.8) achieve a better balance. The FP16 baseline (10.86 PPL) serves as a reference for ideal performance, though no model matches it. The annotations suggest that memory savings and energy efficiency are prioritized in certain variants, but this comes at the cost of higher PPL. The shaded regions visually emphasize efficiency gains, while the red arrows quantify specific improvements. This trade-off is critical for applications requiring real-time processing or resource-constrained environments.