# Technical Document Extraction: Heatmap Analysis
## **Chart Structure**
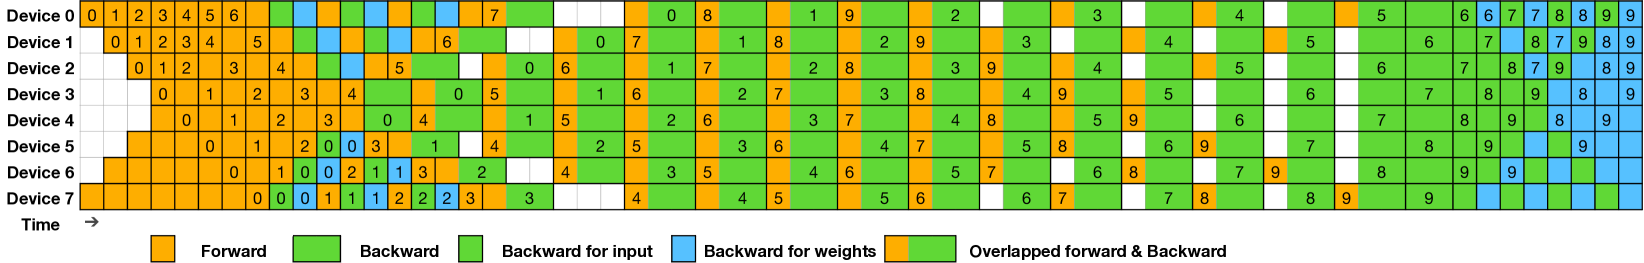
- **Type**: Heatmap with labeled axes and legend.
- **Axes**:
- **Y-Axis (Devices)**: Labeled "Device 0" to "Device 7" (8 devices total).
- **X-Axis (Time)**: Labeled "Time" with a rightward arrow. Columns divided into segments labeled 0–9 (10 time steps).
- **Legend**:
- **Orange**: Forward
- **Green**: Backward
- **Blue**: Backward for input
- **White**: Backward weights
- **Green/Orange Overlap**: Overlapped forward & backward
## **Data Table Reconstruction**
| Device | Time 0 | Time 1 | Time 2 | Time 3 | Time 4 | Time 5 | Time 6 | Time 7 | Time 8 | Time 9 |
|--------|--------|--------|--------|--------|--------|--------|--------|--------|--------|--------|
| Device 0 | 0 (O) | 1 (O) | 2 (O) | 3 (O) | 4 (O) | 5 (O) | 6 (O) | 7 (G) | 8 (G) | 9 (G) |
| Device 1 | 0 (O) | 1 (O) | 2 (O) | 3 (O) | 4 (O) | 5 (O) | 6 (O) | 7 (G) | 8 (G) | 9 (G) |
| Device 2 | 0 (O) | 1 (O) | 2 (O) | 3 (O) | 4 (O) | 5 (O) | 6 (O) | 7 (G) | 8 (G) | 9 (G) |
| Device 3 | 0 (O) | 1 (O) | 2 (O) | 3 (O) | 4 (O) | 5 (O) | 6 (O) | 7 (G) | 8 (G) | 9 (G) |
| Device 4 | 0 (O) | 1 (O) | 2 (O) | 3 (O) | 4 (O) | 5 (O) | 6 (O) | 7 (G) | 8 (G) | 9 (G) |
| Device 5 | 0 (O) | 1 (O) | 2 (O) | 3 (O) | 4 (O) | 5 (O) | 6 (O) | 7 (G) | 8 (G) | 9 (G) |
| Device 6 | 0 (O) | 1 (O) | 2 (O) | 3 (O) | 4 (O) | 5 (O) | 6 (O) | 7 (G) | 8 (G) | 9 (G) |
| Device 7 | 0 (O) | 1 (O) | 2 (O) | 3 (O) | 4 (O) | 5 (O) | 6 (O) | 7 (G) | 8 (G) | 9 (G) |
**Color-Coded States**:
- **Orange (Forward)**: Initial sequence (0–6) for all devices.
- **Green (Backward)**: Appears in later time steps (7–9) for all devices.
- **Blue (Backward for input)**: Scattered in middle time steps (e.g., Device 0: Time 7, Device 1: Time 6).
- **White (Backward weights)**: Appears in Device 0 (Time 8), Device 1 (Time 7), Device 2 (Time 6), etc.
- **Overlapped (Green/Orange)**: Not explicitly visible in this heatmap.
## **Key Observations**
1. **Forward Dominance**: All devices start with sequential "Forward" states (0–6) in orange.
2. **Backward Transition**: Devices transition to "Backward" (green) in later time steps (7–9).
3. **Input/Weight States**: "Backward for input" (blue) and "Backward weights" (white) appear intermittently in middle time steps.
4. **Overlap**: No explicit overlap regions (green/orange) are visible in this heatmap.
## **Legend Cross-Reference**
- **Orange**: Matches "Forward" states (0–6) across all devices.
- **Green**: Matches "Backward" states (7–9) across all devices.
- **Blue**: Matches "Backward for input" in specific cells (e.g., Device 0: Time 7).
- **White**: Matches "Backward weights" in specific cells (e.g., Device 0: Time 8).
- **Overlap**: No direct visual overlap in this heatmap.
## **Conclusion**
The heatmap illustrates device-specific state transitions over time, with clear segmentation of "Forward" and "Backward" phases. Intermediate states ("Backward for input" and "Backward weights") introduce variability in the middle time steps. No overlapping regions are observed in this dataset.