## Line Chart: I/T Specialization vs. Layers
### Overview
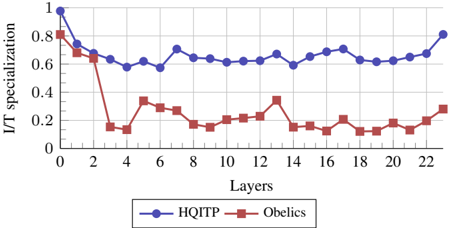
The image is a line chart comparing the I/T specialization of two entities, "HQITP" and "Obelics," across different layers. The x-axis represents the layers, and the y-axis represents the I/T specialization, ranging from 0 to 1.
### Components/Axes
* **X-axis:** "Layers," with numerical markers at 0, 2, 4, 6, 8, 10, 12, 14, 16, 18, 20, and 22.
* **Y-axis:** "I/T specialization," with numerical markers at 0, 0.2, 0.4, 0.6, 0.8, and 1.
* **Legend:** Located at the bottom of the chart.
* Blue line with circular markers: "HQITP"
* Red line with square markers: "Obelics"
### Detailed Analysis
* **HQITP (Blue line, circular markers):**
* Trend: Generally decreasing from layer 0 to layer 4, then relatively stable with minor fluctuations from layer 4 to layer 22.
* Data Points:
* Layer 0: approximately 0.98
* Layer 2: approximately 0.65
* Layer 4: approximately 0.59
* Layer 6: approximately 0.61
* Layer 8: approximately 0.64
* Layer 10: approximately 0.63
* Layer 12: approximately 0.59
* Layer 14: approximately 0.63
* Layer 16: approximately 0.69
* Layer 18: approximately 0.63
* Layer 20: approximately 0.62
* Layer 22: approximately 0.72
* **Obelics (Red line, square markers):**
* Trend: Decreasing sharply from layer 0 to layer 4, then relatively stable with minor fluctuations from layer 4 to layer 22.
* Data Points:
* Layer 0: approximately 0.83
* Layer 2: approximately 0.68
* Layer 4: approximately 0.13
* Layer 6: approximately 0.32
* Layer 8: approximately 0.20
* Layer 10: approximately 0.15
* Layer 12: approximately 0.34
* Layer 14: approximately 0.18
* Layer 16: approximately 0.13
* Layer 18: approximately 0.18
* Layer 20: approximately 0.14
* Layer 22: approximately 0.28
### Key Observations
* HQITP consistently maintains a higher I/T specialization compared to Obelics across all layers.
* Obelics experiences a significant drop in I/T specialization between layers 2 and 4.
* Both HQITP and Obelics show relatively stable I/T specialization after layer 4, with minor fluctuations.
### Interpretation
The chart suggests that HQITP is more specialized than Obelics across the layers examined. The sharp decline in Obelics' I/T specialization between layers 2 and 4 indicates a significant shift or change in its processing or function within those layers. The relatively stable I/T specialization after layer 4 for both entities suggests that their specialization levels reach a steady state after the initial layers. The data could represent the specialization of different neural network architectures or different processing units within a system.