## Line Chart: I/T Specialization vs. Layers
### Overview
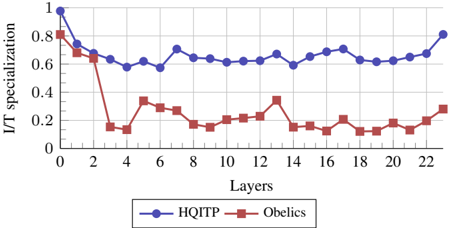
This image presents a line chart illustrating the relationship between I/T specialization and the number of layers in two different models: HQITP and Obelics. The chart displays how I/T specialization changes as the number of layers increases.
### Components/Axes
* **X-axis:** "Layers" - ranging from 0 to 22, with tick marks at integer values.
* **Y-axis:** "I/T specialization" - ranging from 0 to 1, with tick marks at 0.2 intervals.
* **Data Series 1:** HQITP - represented by a blue line with circular markers.
* **Data Series 2:** Obelics - represented by a red line with square markers.
* **Legend:** Located at the bottom-center of the chart, identifying the two data series with their corresponding colors and labels.
### Detailed Analysis
**HQITP (Blue Line):**
The HQITP line starts at approximately 1.0 at Layer 0. It then decreases to approximately 0.65 at Layer 2, then fluctuates between approximately 0.6 and 0.75 from Layer 2 to Layer 22, with a slight upward trend towards the end.
* Layer 0: ~1.0
* Layer 2: ~0.65
* Layer 4: ~0.62
* Layer 6: ~0.60
* Layer 8: ~0.64
* Layer 10: ~0.62
* Layer 12: ~0.65
* Layer 14: ~0.63
* Layer 16: ~0.67
* Layer 18: ~0.62
* Layer 20: ~0.64
* Layer 22: ~0.72
**Obelics (Red Line):**
The Obelics line starts at approximately 0.8 at Layer 0. It rapidly decreases to approximately 0.2 at Layer 2, then fluctuates between approximately 0.15 and 0.35 from Layer 2 to Layer 22, with a slight upward trend towards the end.
* Layer 0: ~0.8
* Layer 2: ~0.2
* Layer 4: ~0.25
* Layer 6: ~0.30
* Layer 8: ~0.28
* Layer 10: ~0.25
* Layer 12: ~0.32
* Layer 14: ~0.22
* Layer 16: ~0.15
* Layer 18: ~0.20
* Layer 20: ~0.25
* Layer 22: ~0.30
### Key Observations
* HQITP consistently exhibits higher I/T specialization values compared to Obelics across all layers.
* Both models show a significant drop in I/T specialization between Layer 0 and Layer 2.
* The Obelics model experiences a more dramatic initial decrease in I/T specialization than HQITP.
* Both lines exhibit fluctuations in I/T specialization as the number of layers increases, suggesting a complex relationship.
* Both lines show a slight upward trend in specialization towards the end of the range (Layers 20-22).
### Interpretation
The chart suggests that the HQITP model maintains a higher degree of I/T specialization as the number of layers increases compared to the Obelics model. The initial drop in specialization for both models could indicate a loss of specific functionality or a diffusion of responsibility as layers are added. The fluctuations observed in both lines suggest that the relationship between layers and specialization is not linear and may be influenced by other factors not represented in this chart. The slight upward trend at the end of the range could indicate a convergence or stabilization of specialization as the models reach a certain level of complexity. The significant difference in specialization between the two models suggests that they may be designed for different purposes or operate under different principles. The rapid decline in Obelics specialization could indicate a more significant trade-off between complexity and specialization in that model.