## Diagram: Model of Human Language Processing vs. Machine Language Processing
### Overview
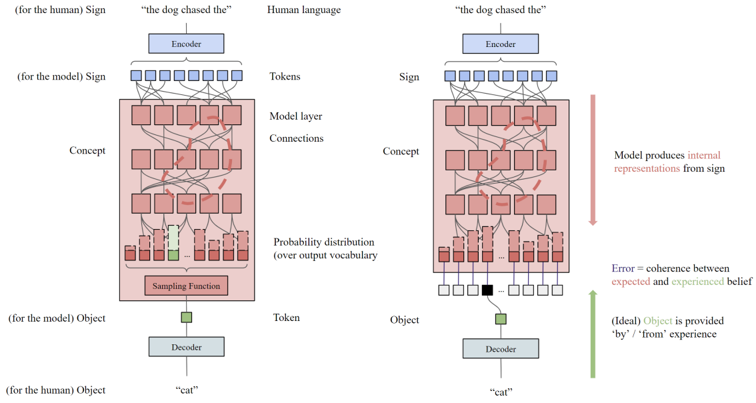
The image presents a comparative diagram illustrating how humans and machines process language. It contrasts the flow of information from sign (input) to object (output) in both systems, highlighting the internal representations and error mechanisms involved. The diagram is split into two parallel depictions: one for human language processing (left) and one for machine language processing (right).
### Components/Axes
* **Top:**
* **(for the human) Sign:** Located at the top-left, indicating the initial input for human language processing.
* **"the dog chased the":** Example of a human language input, positioned above the human language processing diagram.
* **Human language:** Label above the left-hand diagram.
* **Encoder:** A blue box representing the encoding process, present in both human and machine language diagrams.
* **(for the model) Sign:** Located at the top-right, indicating the initial input for machine language processing.
* **"the dog chased the":** Example of a machine language input, positioned above the machine language processing diagram.
* **Middle:**
* **Tokens:** Label indicating the tokenized representation of the input.
* **Model layer:** Label indicating the model layer.
* **Connections:** Label indicating the connections between the model layers.
* **Concept:** Label indicating the conceptual representation.
* **Probability distribution (over output vocabulary):** Label indicating the probability distribution over the output vocabulary.
* **Sampling Function:** Label indicating the sampling function.
* **Bottom:**
* **(for the model) Object:** Located at the bottom, representing the output object for the model.
* **Token:** Label indicating the token.
* **Object:** Label indicating the object.
* **Decoder:** A blue box representing the decoding process, present in both human and machine language diagrams.
* **(for the human) Object:** Located at the bottom-left, representing the output object for human language processing.
* **"cat":** Example of a human language output, positioned below the human language processing diagram.
* **"cat":** Example of a machine language output, positioned below the machine language processing diagram.
* **Right Side:**
* **Model produces internal representations from sign:** A red arrow pointing downwards, indicating the flow of information and internal representation generation.
* **Error = coherence between expected and experienced belief:** A red text label indicating the error mechanism.
* **(Ideal) Object is provided 'by' / 'from' experience:** A green arrow pointing upwards, indicating the ideal object provision.
### Detailed Analysis or Content Details
* **Human Language Processing (Left):**
* The input sign "the dog chased the" is processed by an encoder.
* The encoded information flows through a model layer, represented by a series of interconnected red squares.
* A probability distribution is generated over the output vocabulary.
* A sampling function selects the output token.
* The token is decoded to produce the object "cat".
* There is a green square in the probability distribution, indicating the correct output.
* **Machine Language Processing (Right):**
* The input sign "the dog chased the" is processed by an encoder.
* The encoded information flows through a model layer, represented by a series of interconnected red squares.
* A probability distribution is generated over the output vocabulary.
* The token is decoded to produce the object "cat".
* There is a black square in the probability distribution, indicating an incorrect output.
* **Connections:**
* Both diagrams show connections between the encoder and the model layer, and within the model layer itself.
* The connections are represented by black lines, with some connections highlighted in red dashed lines, possibly indicating errors or deviations.
### Key Observations
* The diagram highlights the similarities and differences between human and machine language processing.
* Both systems involve encoding, model layers, probability distributions, and decoding.
* The key difference lies in the accuracy of the output, with the human system producing the correct output ("cat") and the machine system producing an incorrect output (represented by a black square).
* The red dashed lines in the model layer may indicate areas where the machine model deviates from the human model.
### Interpretation
The diagram illustrates a simplified model of how both humans and machines process language. It suggests that while the fundamental steps are similar, the accuracy and reliability of the output can differ significantly. The diagram emphasizes the importance of internal representations and error mechanisms in language processing. The red dashed lines and the black square in the machine language processing diagram highlight potential areas for improvement in machine learning models. The diagram suggests that the "error" is the coherence between expected and experienced belief, and the ideal object is provided by/from experience.