## Diagram: Language Model Processing Flow Comparison
### Overview
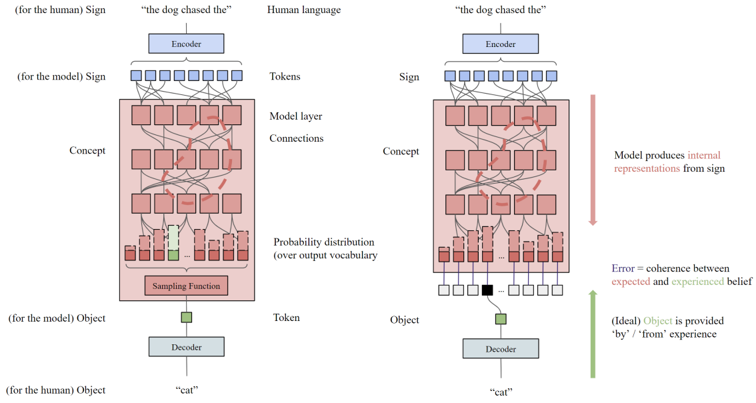
The image is a technical diagram comparing two parallel processes within a neural language model. It illustrates the flow from human language input to model output, contrasting a standard generation process (left) with a process that incorporates an error signal derived from an "ideal" object or experience (right). The diagram uses color-coded components and directional arrows to map the transformation of data.
### Components/Axes
The diagram is split into two main vertical panels, left and right, each depicting a similar but distinct pipeline.
**Common Components (Left & Right Panels):**
* **Top Input:** The phrase `"the dog chased the"` is shown as the starting point, labeled as **Human language**.
* **Encoder:** A blue rectangular box labeled **Encoder** processes the input.
* **Tokens:** A row of small blue squares representing the tokenized input.
* **Model Layer Connections:** A large red-shaded area containing multiple rows of interconnected red squares, representing the neural network's layers and internal processing.
* **Concept:** A label pointing to the internal representations within the model layers.
* **Probability Distribution:** A row of vertical bars of varying heights, labeled **Probability distribution (over output vocabulary)**.
* **Object (Token):** A single green square representing the selected output token.
* **Decoder:** A blue rectangular box labeled **Decoder** processes the output token.
* **Bottom Output:** The word `"cat"` is shown as the final output.
* **Perspective Labels:** Text in parentheses clarifies the viewpoint: **(for the human)** and **(for the model)**.
**Unique Components (Right Panel Only):**
* **Sampling Function:** A red box labeled **Sampling Function** is present in the left panel but absent in the right.
* **Error Annotation:** A vertical red arrow on the right side is accompanied by text: **Error = coherence between expected and experienced belief**.
* **Ideal Object Annotation:** A vertical green arrow on the right side is accompanied by text: **(Ideal) Object is provided 'by' / 'from' experience**.
* **Ideal Object Input:** A small black square feeds into the Decoder in the right panel, representing the "ideal" object.
### Detailed Analysis
**Left Panel Flow (Standard Generation):**
1. **Input:** Human language `"the dog chased the"` enters the system.
2. **Tokenization:** The **Encoder** converts the input into a sequence of **Tokens** (blue squares).
3. **Internal Processing:** The tokens pass through the **Model layer Connections**, generating internal **Concept** representations.
4. **Prediction:** The model outputs a **Probability distribution** over the vocabulary. A specific token (green square) is selected via a **Sampling Function**.
5. **Output:** The selected **Object (Token)** is processed by the **Decoder** to produce the human-readable output `"cat"`.
**Right Panel Flow (Process with Error Signal):**
1. **Input & Processing:** Steps 1-3 are identical to the left panel.
2. **Prediction & Comparison:** The model produces a **Probability distribution**. The diagram implies a comparison occurs here.
3. **Error Calculation:** The **Error** is defined as the **coherence between expected and experienced belief**. This suggests a discrepancy between the model's predicted distribution and an external reference.
4. **Ideal Object Integration:** An **(Ideal) Object** (black square), provided **'by' / 'from' experience**, is fed directly into the **Decoder**.
5. **Output:** The Decoder produces the output `"cat"`, now informed by both the model's prediction and the ideal object.
**Spatial Grounding:**
* The **Legend/Annotations** (Error, Ideal Object) are placed vertically along the right edge of the right panel.
* The **Probability Distribution** bars are located at the bottom of the red model layer block in both panels.
* The **Sampling Function** box is located directly below the probability distribution in the left panel only.
* The **Ideal Object** (black square) is positioned between the probability distribution and the Decoder in the right panel.
### Key Observations
1. **Structural Difference:** The core difference is the replacement of the **Sampling Function** (left) with an **Error** calculation and an **Ideal Object** input (right).
2. **Direction of Information:** The left panel shows a purely feed-forward generative process. The right panel introduces a supervisory signal (the Ideal Object) that influences the final output via the Decoder.
3. **Conceptual Labels:** The use of **"Sign"** (for the input tokens) and **"Object"** (for the output token) suggests a semiotic framework, where the model maps signs to objects.
4. **Color Coding:** Blue is used for encoding/decoding interfaces, red for the model's internal "black box" and processing, and green for the model's selected output object. Black is used for the external "ideal" object.
### Interpretation
This diagram illustrates a conceptual model for how a language model might learn or be corrected. The left side represents standard autoregressive generation, where the model samples from its own predicted distribution. The right side depicts a supervised or reinforcement learning scenario.
The **"Error = coherence between expected and experienced belief"** is the critical component. It frames the model's prediction ("expected belief") against a ground-truth or target output ("experienced belief" or **Ideal Object**). This error signal is likely used to adjust the model's internal parameters (the **Concept** layers) to improve future predictions.
The diagram suggests that for effective learning or alignment, the model's internal representations (**Concept**) must be updated based on the discrepancy between its output and an externally provided ideal. The flow implies that the **Decoder** plays a role in integrating this corrective signal. Overall, it's a visual representation of a feedback loop for model training or refinement, moving from simple generation to generation informed by external validation.