# Technical Data Extraction: Accuracy vs. Model Generation Budget
## 1. Image Classification
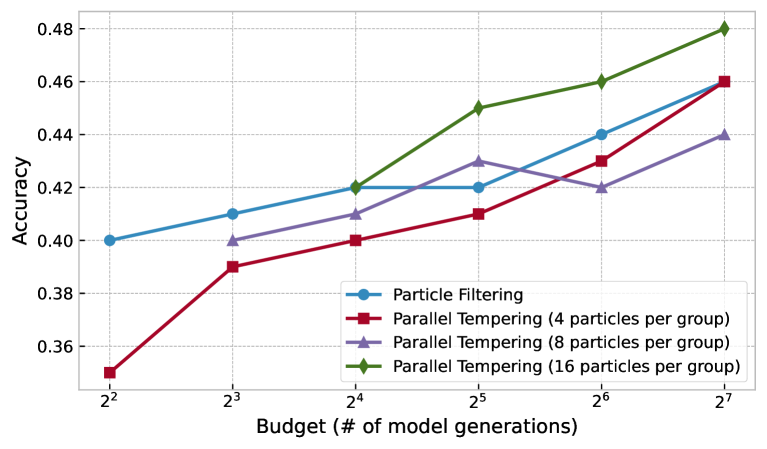
This image is a **line graph** comparing the performance (Accuracy) of different sampling algorithms across varying computational budgets.
## 2. Component Isolation
### Header/Metadata
* **Language:** English
* **Primary Subject:** Performance comparison of Particle Filtering vs. Parallel Tempering variants.
### Axis Definitions
* **Y-Axis (Vertical):**
* **Label:** Accuracy
* **Scale:** Linear, ranging from 0.36 to 0.48 with major ticks every 0.02 units.
* **X-Axis (Horizontal):**
* **Label:** Budget (# of model generations)
* **Scale:** Logarithmic (Base 2), with markers at $2^2, 2^3, 2^4, 2^5, 2^6, 2^7$.
### Legend (Spatial Grounding: Bottom-Right [x≈0.7, y≈0.2])
The legend contains four entries, each associated with a specific color and marker shape:
1. **Blue line with Circle markers (●):** Particle Filtering
2. **Red line with Square markers (■):** Parallel Tempering (4 particles per group)
3. **Purple line with Triangle markers (▲):** Parallel Tempering (8 particles per group)
4. **Green line with Diamond markers (♦):** Parallel Tempering (16 particles per group)
---
## 3. Trend Verification and Data Extraction
### Series 1: Particle Filtering (Blue, Circle)
* **Trend:** Shows a steady, monotonic upward slope from $2^2$ to $2^4$, plateaus between $2^4$ and $2^5$, and then resumes a steady upward slope to $2^7$.
* **Data Points:**
* $2^2$: 0.40
* $2^3$: 0.41
* $2^4$: 0.42
* $2^5$: 0.42
* $2^6$: 0.44
* $2^7$: 0.46
### Series 2: Parallel Tempering (4 particles per group) (Red, Square)
* **Trend:** Shows the most significant initial gain between $2^2$ and $2^3$. It maintains a consistent upward slope throughout the entire budget range, ending at the same accuracy as Particle Filtering.
* **Data Points:**
* $2^2$: 0.35
* $2^3$: 0.39
* $2^4$: 0.40
* $2^5$: 0.41
* $2^6$: 0.43
* $2^7$: 0.46
### Series 3: Parallel Tempering (8 particles per group) (Purple, Triangle)
* **Trend:** Generally upward sloping, but exhibits a "sawtooth" pattern or fluctuation. It increases until $2^5$, drops slightly at $2^6$, and recovers at $2^7$. It starts at a higher budget ($2^3$) than the 4-particle version.
* **Data Points:**
* $2^3$: 0.40
* $2^4$: 0.41
* $2^5$: 0.43
* $2^6$: 0.42
* $2^7$: 0.44
### Series 4: Parallel Tempering (16 particles per group) (Green, Diamond)
* **Trend:** This is the highest-performing series. It shows a strong, consistent upward slope from its starting point at $2^4$ to the end of the budget range at $2^7$.
* **Data Points:**
* $2^4$: 0.42
* $2^5$: 0.45
* $2^6$: 0.46
* $2^7$: 0.48
---
## 4. Reconstructed Data Table
| Budget ($2^x$) | Particle Filtering (Blue ●) | PT - 4 particles (Red ■) | PT - 8 particles (Purple ▲) | PT - 16 particles (Green ♦) |
| :--- | :--- | :--- | :--- | :--- |
| **$2^2$ (4)** | 0.40 | 0.35 | - | - |
| **$2^3$ (8)** | 0.41 | 0.39 | 0.40 | - |
| **$2^4$ (16)** | 0.42 | 0.40 | 0.41 | 0.42 |
| **$2^5$ (32)** | 0.42 | 0.41 | 0.43 | 0.45 |
| **$2^6$ (64)** | 0.44 | 0.43 | 0.42 | 0.46 |
| **$2^7$ (128)** | 0.46 | 0.46 | 0.44 | 0.48 |
---
## 5. Key Observations
* **Scalability:** All methods show improved accuracy as the budget increases.
* **Particle Density:** For Parallel Tempering, increasing the number of particles per group generally shifts the curve upward (higher accuracy), though it requires a higher minimum budget to initialize.
* **Top Performer:** "Parallel Tempering (16 particles per group)" consistently outperforms all other methods once the budget reaches $2^5$.
* **Convergence:** At the maximum budget ($2^7$), Particle Filtering and Parallel Tempering (4 particles) converge at an accuracy of 0.46.