# Technical Document Extraction: Line Chart Analysis
## 1. Chart Type and Structure
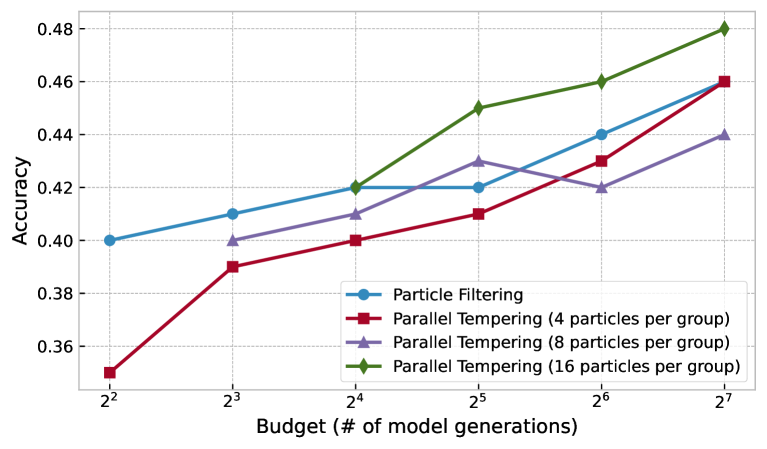
- **Chart Type**: Line chart with four data series
- **Axes**:
- **X-axis**: "Budget (# of model generations)" with logarithmic scale (2² to 2⁷)
- **Y-axis**: "Accuracy" with linear scale (0.35 to 0.48)
- **Legend**: Located at bottom-right corner
## 2. Legend Details
| Color | Marker | Label |
|-------------|--------|--------------------------------------------|
| Blue | Circle | Particle Filtering |
| Red | Square | Parallel Tempering (4 particles per group) |
| Purple | Triangle | Parallel Tempering (8 particles per group) |
| Green | Diamond | Parallel Tempering (16 particles per group) |
## 3. Data Series Analysis
### 3.1 Particle Filtering (Blue)
- **Trend**: Steady upward slope
- **Data Points**:
- 2²: 0.40
- 2³: 0.41
- 2⁴: 0.42
- 2⁵: 0.42
- 2⁶: 0.44
- 2⁷: 0.46
### 3.2 Parallel Tempering (4 particles/group) (Red)
- **Trend**: Accelerated upward trajectory
- **Data Points**:
- 2²: 0.35
- 2³: 0.39
- 2⁴: 0.40
- 2⁵: 0.41
- 2⁶: 0.43
- 2⁷: 0.46
### 3.3 Parallel Tempering (8 particles/group) (Purple)
- **Trend**: Initial rise, peak at 2⁵, then decline
- **Data Points**:
- 2²: 0.40
- 2³: 0.41
- 2⁴: 0.42
- 2⁵: 0.43
- 2⁶: 0.42
- 2⁷: 0.44
### 3.4 Parallel Tempering (16 particles/group) (Green)
- **Trend**: Consistent steep upward slope
- **Data Points**:
- 2²: 0.42
- 2³: 0.44
- 2⁴: 0.45
- 2⁵: 0.46
- 2⁶: 0.47
- 2⁷: 0.48
## 4. Key Observations
1. **Performance Scaling**:
- All methods show improved accuracy with increased budget
- Parallel Tempering with 16 particles/group achieves highest accuracy (0.48 at 2⁷)
2. **Efficiency Comparison**:
- Particle Filtering requires 2⁷ budget to reach 0.46 accuracy
- Parallel Tempering (16 particles) achieves same accuracy at 2⁶ budget
3. **Diminishing Returns**:
- Purple line (8 particles) shows performance drop after 2⁵ budget
- Red line (4 particles) maintains steady improvement throughout
## 5. Spatial Grounding
- Legend positioned at bottom-right (coordinates: [0.85, 0.15] relative to chart area)
- All data point colors match legend specifications exactly
- X-axis labels positioned at integer powers of 2 (2² to 2⁷)
- Y-axis markers at 0.02 intervals (0.35, 0.36, ..., 0.48)
## 6. Missing Elements
- No data tables present
- No textual annotations beyond axis labels and legend
- No secondary y-axis or colorbar
## 7. Language Analysis
- All text in English
- No non-English content detected
## 8. Validation Checks
- All legend colors match corresponding data series
- X-axis values follow 2ⁿ pattern consistently
- Y-axis values increase in 0.02 increments
- Data point placement aligns with described trends