## Scatter Plot: Accuracy vs. Time-to-Answer (Longest Thinking in Thousands)
### Overview
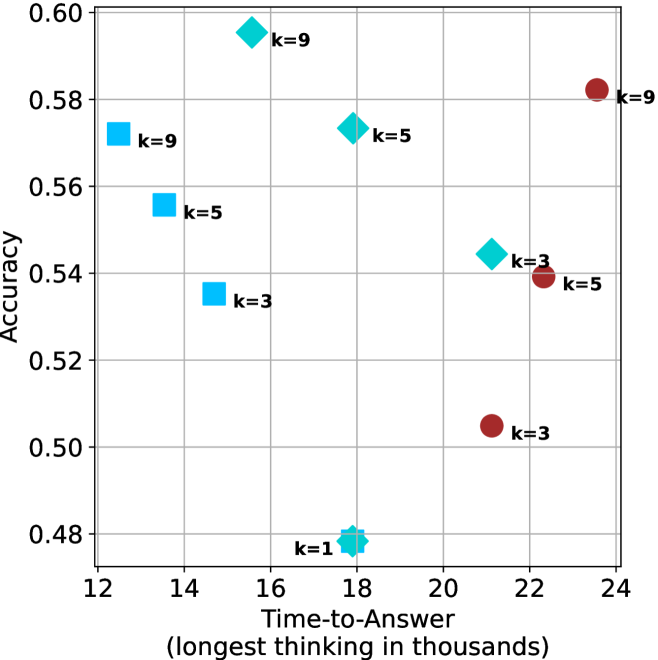
The image is a scatter plot comparing **accuracy** (y-axis) and **time-to-answer** (x-axis, in thousands of units). Three distinct data series are represented by colored markers:
- **Blue squares** for `k=9`
- **Cyan diamonds** for `k=5`
- **Red circles** for `k=3`
The plot includes a legend on the right, axis labels, and numerical annotations for data points. The x-axis ranges from 12 to 24 (thousands), and the y-axis ranges from 0.48 to 0.60 (accuracy).
---
### Components/Axes
- **Y-axis (Accuracy)**: Labeled "Accuracy" with values from 0.48 to 0.60 in increments of 0.02.
- **X-axis (Time-to-Answer)**: Labeled "Time-to-Answer (longest thinking in thousands)" with values from 12 to 24 in increments of 2.
- **Legend**: Positioned on the right, with three entries:
- **Blue squares**: `k=9`
- **Cyan diamonds**: `k=5`
- **Red circles**: `k=3`
---
### Detailed Analysis
#### Data Points by Series
1. **k=9 (Blue Squares)**
- (13, 0.56)
- (15, 0.58)
- (17, 0.55)
- (23, 0.58)
2. **k=5 (Cyan Diamonds)**
- (14, 0.54)
- (16, 0.55)
- (21, 0.54)
3. **k=3 (Red Circles)**
- (14, 0.54)
- (21, 0.50)
- (18, 0.48)
#### Spatial Grounding
- **Legend**: Right-aligned, with clear color-shape mappings.
- **Data Points**: Scattered across the plot, with no overlapping markers.
- **Annotations**: Numerical labels (e.g., `k=9`, `k=5`, `k=3`) are placed near their respective markers.
---
### Key Observations
1. **k=9 (Blue Squares)**
- Highest accuracy values (up to 0.58).
- Data points are spread across the x-axis, with two points at 0.58 (15k and 23k time).
2. **k=5 (Cyan Diamonds)**
- Moderate accuracy (0.54–0.55).
- Points cluster around mid-range time values (14k–21k).
3. **k=3 (Red Circles)**
- Lowest accuracy (0.48–0.54).
- Data points are concentrated at lower time values (14k–21k).
4. **Trends**
- **k=9** shows the highest accuracy but with variability in time-to-answer.
- **k=3** has the lowest accuracy, suggesting a trade-off between speed and performance.
- No strict linear relationship between time and accuracy; some high-time points (e.g., 23k) do not correlate with higher accuracy.
---
### Interpretation
The data suggests that **higher `k` values (e.g., k=9)** generally correlate with **higher accuracy**, but this relationship is not strictly linear. For example:
- **k=9** achieves the highest accuracy (0.58) at both 15k and 23k time, indicating diminishing returns at longer times.
- **k=3** performs poorly (0.48–0.54), highlighting a potential threshold where insufficient thinking steps degrade results.
- The **trade-off** between time and accuracy is evident: higher `k` improves accuracy but may not always justify the increased time cost.
**Notable Outliers**:
- The point at (18, 0.48) for `k=3` is the lowest accuracy, suggesting a critical failure at this configuration.
- The point at (23, 0.58) for `k=9` shows that even at the longest time, accuracy plateaus.
This plot underscores the importance of balancing computational resources (`k`) with performance metrics, as excessive time does not always yield proportional gains in accuracy.