## Diagram Type: Flowchart
### Overview
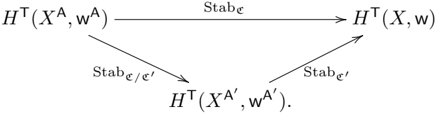
The image depicts a flowchart with arrows indicating the direction of processes or transformations. The chart includes three main components: H^T(X^A, w^A), H^T(X, w), and H^T(X^A', w^A'). Arrows connect these components, suggesting a sequence of operations or relationships between them.
### Components/Axes
- **H^T(X^A, w^A)**: This is the starting point of the flowchart.
- **H^T(X, w)**: This is the intermediate point, connected by an arrow labeled "Stab_c".
- **H^T(X^A', w^A')**: This is the final point, connected by an arrow labeled "Stab_c'".
### Detailed Analysis or ### Content Details
- The flowchart shows a transformation from H^T(X^A, w^A) to H^T(X, w) and then to H^T(X^A', w^A').
- The arrow labeled "Stab_c" suggests a stabilization or stabilization process applied to H^T(X^A, w^A) to produce H^T(X, w).
- The arrow labeled "Stab_c'" suggests a stabilization or stabilization process applied to H^T(X, w) to produce H^T(X^A', w^A').
### Key Observations
- The flowchart indicates a sequential process with stabilization steps.
- The transformation from H^T(X^A, w^A) to H^T(X, w) and then to H^T(X^A', w^A') suggests a transformation or mapping of data or variables.
### Interpretation
The flowchart likely represents a process or algorithm where H^T(X^A, w^A) is transformed into H^T(X, w) through a stabilization process, and then further transformed into H^T(X^A', w^A') through another stabilization process. The stabilization processes could be related to data normalization, feature extraction, or other data processing techniques. The exact nature of the transformation and stabilization processes would depend on the specific context and application of the flowchart.