## Heatmap and Line Graphs: Test Accuracy vs. Input Dimensions and Symbols
### Overview
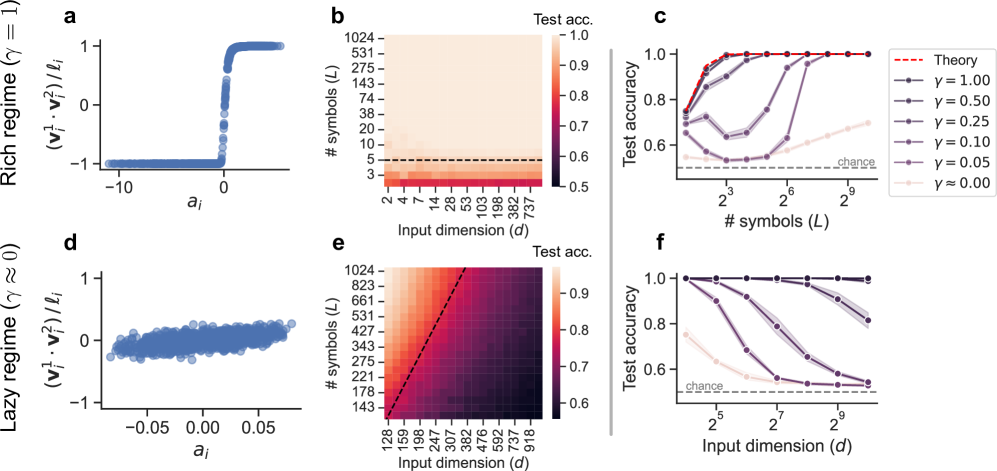
The image contains six subplots (a-f) arranged in a 2x3 grid, analyzing the relationship between input dimensions, number of symbols, and test accuracy under different regimes (rich vs. lazy). Key elements include heatmaps, scatter plots, and line graphs with legends indicating parameter values (γ).
---
### Components/Axes
#### Subplot a (Top-Left)
- **X-axis**: `a_i` (input dimension)
- **Y-axis**: `(v_i^1 · v_i^2)/ℓ_i` (normalized dot product)
- **Legend**:
- "Rich regime (γ = 1)" (blue line)
- "Lazy regime (γ ≈ 0)" (blue dots)
- **Spatial Placement**: Legend in top-right corner.
#### Subplot b (Top-Center)
- **X-axis**: Input dimension (`d`)
- **Y-axis**: Number of symbols (`L`)
- **Color Scale**: Test accuracy (0.5–1.0, red to yellow)
- **Dashed Line**: Horizontal line at `L = 3` (input dimension threshold).
- **Legend**: None (colorbar instead).
#### Subplot c (Top-Right)
- **X-axis**: Number of symbols (`L`)
- **Y-axis**: Test accuracy (0.0–1.0)
- **Legend**:
- Red dashed line: γ = 1.0 (theory)
- Purple lines: γ = 0.50, 0.25, 0.10, 0.05 (solid lines)
- Light gray dashed line: "chance" (baseline)
- **Spatial Placement**: Legend in top-right corner.
#### Subplot d (Bottom-Left)
- **X-axis**: `a_i` (input dimension)
- **Y-axis**: `(v_i^1 · v_i^2)/ℓ_i` (normalized dot product)
- **Legend**:
- "Lazy regime (γ ≈ 0)" (blue dots)
- **Spatial Placement**: Legend in top-right corner.
#### Subplot e (Bottom-Center)
- **X-axis**: Input dimension (`d`)
- **Y-axis**: Number of symbols (`L`)
- **Color Scale**: Test accuracy (0.6–0.9, dark red to light red)
- **Dashed Line**: Diagonal line at `d = L` (input dimension = symbols).
- **Legend**: None (colorbar instead).
#### Subplot f (Bottom-Right)
- **X-axis**: Input dimension (`d`)
- **Y-axis**: Test accuracy (0.0–1.0)
- **Legend**:
- Purple lines: γ = 1.00, 0.50, 0.25, 0.10, 0.05 (solid lines)
- Light gray dashed line: "chance" (baseline)
- **Spatial Placement**: Legend in top-right corner.
---
### Detailed Analysis
#### Subplot a
- **Trend**: A step-like transition from negative to positive values at `a_i ≈ 0`, indicating a regime shift.
- **Data Points**: Blue dots cluster near `a_i = 0` for the lazy regime (γ ≈ 0).
#### Subplot b
- **Trend**: Test accuracy increases with input dimension (`d`) and number of symbols (`L`), but plateaus at `L = 3` (dashed line).
- **Key Values**:
- At `L = 3`, test accuracy ≈ 0.75 (dashed line).
- At `L = 10`, test accuracy ≈ 0.95 (yellow region).
#### Subplot c
- **Trend**: Test accuracy improves with higher γ values.
- γ = 1.0 (red dashed line) achieves near-perfect accuracy (≈ 0.95) for `L ≥ 8`.
- Lower γ values (e.g., γ = 0.05) show diminishing returns, with accuracy dropping to ≈ 0.6 for `L = 2`.
#### Subplot d
- **Trend**: Similar to subplot a but with a broader spread of values for the lazy regime (γ ≈ 0), suggesting less distinct regime separation.
#### Subplot e
- **Trend**: Test accuracy increases with input dimension (`d`) and number of symbols (`L`), but the diagonal dashed line (`d = L`) marks a critical threshold where accuracy stabilizes.
#### Subplot f
- **Trend**: Test accuracy improves with higher γ values and input dimension (`d`).
- γ = 1.0 (red dashed line) achieves ≈ 0.95 accuracy for `d ≥ 8`.
- Lower γ values (e.g., γ = 0.05) show accuracy ≈ 0.6 for `d = 2`.
---
### Key Observations
1. **Regime Separation**:
- The rich regime (γ = 1) shows sharp transitions (subplots a, c, f), while the lazy regime (γ ≈ 0) exhibits gradual changes (subplots a, d).
2. **Input Dimension Impact**:
- Higher input dimensions (`d`) correlate with improved test accuracy, especially for γ ≥ 0.5 (subplots b, e, f).
3. **Symbol Threshold**:
- A critical threshold at `L = 3` (subplot b) and `d = L` (subplot e) marks a plateau in performance.
4. **Chance Baseline**:
- The "chance" line (≈ 0.5 accuracy) is consistently below all γ > 0 regimes (subplots c, f).
---
### Interpretation
- **γ as a Control Parameter**: Higher γ values (rich regime) enable faster convergence and higher accuracy, particularly for complex input dimensions (`d`) and symbol counts (`L`).
- **Input Dimension vs. Symbols**: Test accuracy improves when input dimension (`d`) exceeds the number of symbols (`L`), as seen in the diagonal threshold in subplot e.
- **Practical Implications**:
- For γ = 1.0, systems achieve near-optimal performance with `d ≥ 8` and `L ≥ 8`.
- Lower γ values (e.g., γ = 0.05) require significantly larger input dimensions to match performance, highlighting the trade-off between computational cost and accuracy.
- **Anomalies**:
- The plateau at `L = 3` (subplot b) suggests a structural limit in the model’s ability to generalize beyond a certain symbol count, regardless of input dimension.
This analysis underscores the critical role of γ in balancing model complexity and performance, with practical guidance for optimizing input dimensions and symbol counts.