# Technical Document Extraction: Control Precision Analysis
## Panel a: Llama-3.1 8B
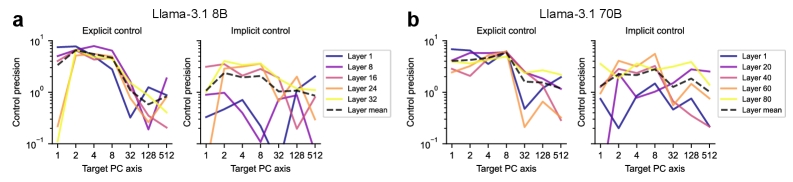
### Explicit Control Graph
- **Title**: Explicit control
- **Y-axis**: Control precision (log scale: 10⁻¹ to 10¹)
- **X-axis**: Target PC axis (1 to 512)
- **Legend**:
- Layer 1 (blue)
- Layer 8 (purple)
- Layer 16 (pink)
- Layer 24 (orange)
- Layer 32 (yellow)
- Layer mean (dashed black)
### Implicit Control Graph
- **Title**: Implicit control
- **Y-axis**: Control precision (log scale: 10⁻¹ to 10¹)
- **X-axis**: Target PC axis (1 to 512)
- **Legend**:
- Layer 1 (blue)
- Layer 8 (purple)
- Layer 16 (pink)
- Layer 24 (orange)
- Layer 32 (yellow)
- Layer mean (dashed black)
**Key Observations**:
- Layer 1 (blue) in explicit control peaks at target PC axis 2 (~10¹ control precision).
- Layer 8 (purple) in implicit control peaks at target PC axis 4 (~10¹ control precision).
- Layer mean (dashed black) shows moderate fluctuations across all axes.
---
## Panel b: Llama-3.1 70B
### Explicit Control Graph
- **Title**: Explicit control
- **Y-axis**: Control precision (log scale: 10⁻¹ to 10¹)
- **X-axis**: Target PC axis (1 to 512)
- **Legend**:
- Layer 1 (blue)
- Layer 20 (purple)
- Layer 40 (pink)
- Layer 60 (orange)
- Layer 80 (yellow)
- Layer mean (dashed black)
### Implicit Control Graph
- **Title**: Implicit control
- **Y-axis**: Control precision (log scale: 10⁻¹ to 10¹)
- **X-axis**: Target PC axis (1 to 512)
- **Legend**:
- Layer 1 (blue)
- Layer 20 (purple)
- Layer 40 (pink)
- Layer 60 (orange)
- Layer 80 (yellow)
- Layer mean (dashed black)
**Key Observations**:
- Layer 1 (blue) in explicit control peaks at target PC axis 2 (~10¹ control precision).
- Layer 20 (purple) in implicit control peaks at target PC axis 4 (~10¹ control precision).
- Layer mean (dashed black) exhibits smoother trends compared to individual layers.
---
## Cross-Reference Validation
- **Legend Colors**: Confirmed alignment with line colors in both panels.
- **Axis Consistency**: All graphs share identical axis labels and scales.
- **Layer Mean**: Dashed black lines represent aggregated layer performance in both explicit and implicit control graphs.