## Chart: LM Loss vs. PFLOP/s-days
### Overview
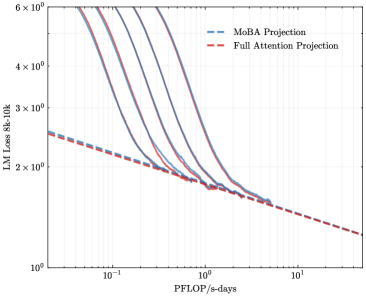
The image is a line chart comparing the Language Model (LM) Loss of "MoBA Projection" and "Full Attention Projection" models against the computational cost measured in PFLOP/s-days. The y-axis represents LM Loss (8k-10k), and the x-axis represents PFLOP/s-days. There are multiple lines for MoBA Projection, likely representing different configurations or runs.
### Components/Axes
* **Title:** Implicit, comparing LM Loss vs. PFLOP/s-days for MoBA and Full Attention Projections.
* **X-axis:** PFLOP/s-days (Peta Floating Point Operations per second-days). Scale ranges from approximately 0.05 to 10.
* **Y-axis:** LM Loss 8k-10k (Language Model Loss). Logarithmic scale ranging from 1 x 10^0 to 6 x 10^0.
* **Legend (Top-Right):**
* Blue dashed line: MoBA Projection
* Red dashed line: Full Attention Projection
### Detailed Analysis
* **Full Attention Projection (Red Dashed Line):**
* Trend: The line slopes downward consistently.
* Data Points:
* At PFLOP/s-days = 0.05, LM Loss ≈ 2.5 x 10^0
* At PFLOP/s-days = 1, LM Loss ≈ 1.7 x 10^0
* At PFLOP/s-days = 10, LM Loss ≈ 1.2 x 10^0
* **MoBA Projection (Blue Lines):**
* Trend: Multiple blue lines, all generally sloping downward, but with a steeper initial decline compared to the Full Attention Projection. The lines converge around PFLOP/s-days = 1.
* Data Points (Estimates for the leftmost MoBA line):
* At PFLOP/s-days = 0.05, LM Loss ≈ 6 x 10^0
* At PFLOP/s-days = 0.2, LM Loss ≈ 3 x 10^0
* At PFLOP/s-days = 1, LM Loss ≈ 1.7 x 10^0
### Key Observations
* The Full Attention Projection has a lower initial LM Loss at low PFLOP/s-days compared to the MoBA Projection.
* The MoBA Projection lines show a rapid decrease in LM Loss initially, converging with the Full Attention Projection around 1 PFLOP/s-days.
* Beyond 1 PFLOP/s-days, the LM Loss for both projections decreases at a similar rate.
### Interpretation
The chart compares the performance of two language model projection techniques, MoBA and Full Attention, in terms of LM Loss versus computational cost. The MoBA projection initially has a higher loss but improves rapidly with increasing computational resources, eventually converging with the Full Attention projection. This suggests that MoBA projection may be more efficient in terms of reducing loss with increased computation, at least in the initial stages. The Full Attention projection provides a more stable, albeit slower, reduction in loss. The multiple MoBA lines likely represent different configurations or runs, indicating some variability in the MoBA projection's performance.