## Chart: LM Loss vs. PFLOP/s-days
### Overview
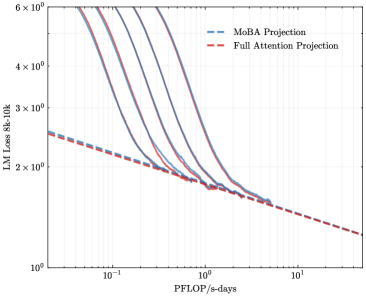
The image presents a line chart comparing the Language Model (LM) Loss for two projection methods: MoBA Projection and Full Attention Projection, plotted against PFLOP/s-days (floating point operations per second per day). The chart displays multiple lines for each projection method, likely representing different runs or trials. The y-axis is on a logarithmic scale.
### Components/Axes
* **X-axis:** PFLOP/s-days. Scale is logarithmic, ranging from approximately 10<sup>-1</sup> to 10<sup>1</sup>.
* **Y-axis:** LM Loss 8k-10k. Scale is logarithmic, ranging from approximately 10<sup>0</sup> to 6 x 10<sup>6</sup>.
* **Legend:** Located in the top-right corner.
* MoBA Projection (Blue dashed line)
* Full Attention Projection (Red dashed line)
* **Lines:** Multiple lines are present for each projection method, showing variations in performance.
### Detailed Analysis
**MoBA Projection (Blue dashed lines):**
There are approximately 6 blue dashed lines. The lines generally exhibit a steep downward slope initially, indicating a rapid decrease in LM Loss as PFLOP/s-days increase. The slope gradually decreases as PFLOP/s-days increase, suggesting diminishing returns.
* Line 1: Starts at approximately (10<sup>-1</sup>, 5 x 10<sup>6</sup>) and ends at approximately (10<sup>1</sup>, 2 x 10<sup>2</sup>).
* Line 2: Starts at approximately (10<sup>-1</sup>, 5 x 10<sup>6</sup>) and ends at approximately (10<sup>1</sup>, 1 x 10<sup>2</sup>).
* Line 3: Starts at approximately (10<sup>-1</sup>, 5 x 10<sup>6</sup>) and ends at approximately (10<sup>1</sup>, 5 x 10<sup>1</sup>).
* Line 4: Starts at approximately (10<sup>-1</sup>, 5 x 10<sup>6</sup>) and ends at approximately (10<sup>1</sup>, 3 x 10<sup>1</sup>).
* Line 5: Starts at approximately (10<sup>-1</sup>, 5 x 10<sup>6</sup>) and ends at approximately (10<sup>1</sup>, 2 x 10<sup>1</sup>).
* Line 6: Starts at approximately (10<sup>-1</sup>, 5 x 10<sup>6</sup>) and ends at approximately (10<sup>1</sup>, 1 x 10<sup>1</sup>).
**Full Attention Projection (Red dashed lines):**
There are approximately 6 red dashed lines. Similar to the MoBA Projection, these lines also show a downward trend, but appear to be slightly less steep overall.
* Line 1: Starts at approximately (10<sup>-1</sup>, 5 x 10<sup>6</sup>) and ends at approximately (10<sup>1</sup>, 3 x 10<sup>2</sup>).
* Line 2: Starts at approximately (10<sup>-1</sup>, 5 x 10<sup>6</sup>) and ends at approximately (10<sup>1</sup>, 2 x 10<sup>2</sup>).
* Line 3: Starts at approximately (10<sup>-1</sup>, 5 x 10<sup>6</sup>) and ends at approximately (10<sup>1</sup>, 1 x 10<sup>2</sup>).
* Line 4: Starts at approximately (10<sup>-1</sup>, 5 x 10<sup>6</sup>) and ends at approximately (10<sup>1</sup>, 5 x 10<sup>1</sup>).
* Line 5: Starts at approximately (10<sup>-1</sup>, 5 x 10<sup>6</sup>) and ends at approximately (10<sup>1</sup>, 3 x 10<sup>1</sup>).
* Line 6: Starts at approximately (10<sup>-1</sup>, 5 x 10<sup>6</sup>) and ends at approximately (10<sup>1</sup>, 2 x 10<sup>1</sup>).
### Key Observations
* Both projection methods demonstrate a reduction in LM Loss as PFLOP/s-days increase.
* MoBA Projection generally achieves lower LM Loss values compared to Full Attention Projection for a given PFLOP/s-days value.
* There is variability in performance within each projection method, as indicated by the multiple lines.
* The logarithmic scale on both axes compresses the data, making it difficult to discern precise differences at lower loss values.
### Interpretation
The chart suggests that both MoBA Projection and Full Attention Projection are effective in reducing LM Loss with increased computational resources (PFLOP/s-days). However, MoBA Projection appears to be more efficient, achieving lower loss values for the same computational cost. The multiple lines for each method likely represent different training runs, highlighting the inherent variability in machine learning training processes. The diminishing returns observed at higher PFLOP/s-days suggest that there is a point beyond which increasing computational resources yields progressively smaller improvements in LM Loss. This information is valuable for optimizing the trade-off between computational cost and model performance. The use of a logarithmic scale indicates that the researchers were particularly interested in observing the behavior of the loss function across a wide range of values, especially at lower loss levels where differences might be more subtle.