\n
## Diagram: Topic Areas
### Overview
The image presents a grid of twelve rectangular boxes, each containing a short phrase. The arrangement suggests a categorization or mapping of different topic areas. There are no axes, legends, or numerical data present. This is a purely textual representation of concepts.
### Components/Axes
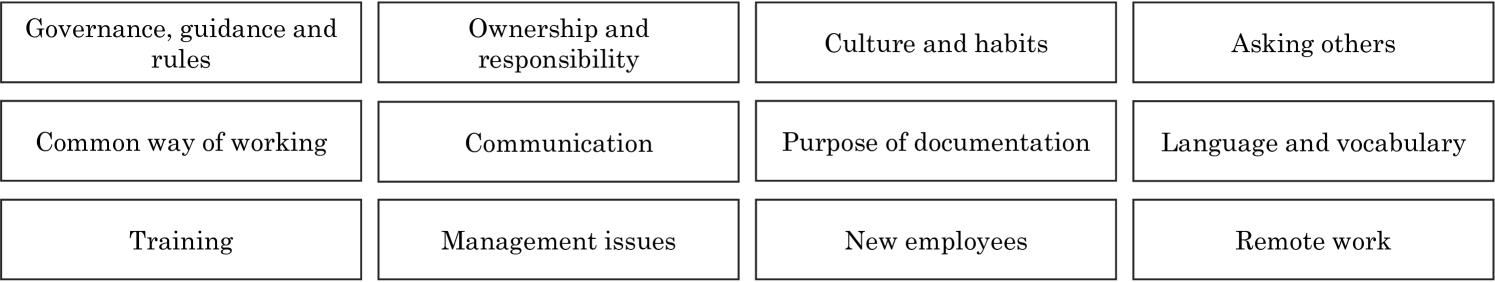
The diagram consists of a 3x4 grid of labeled boxes. The labels are as follows:
* Row 1, Column 1: "Governance, guidance and rules"
* Row 1, Column 2: "Ownership and responsibility"
* Row 1, Column 3: "Culture and habits"
* Row 1, Column 4: "Asking others"
* Row 2, Column 1: "Common way of working"
* Row 2, Column 2: "Communication"
* Row 2, Column 3: "Purpose of documentation"
* Row 2, Column 4: "Language and vocabulary"
* Row 3, Column 1: "Training"
* Row 3, Column 2: "Management issues"
* Row 3, Column 3: "New employees"
* Row 3, Column 4: "Remote work"
### Detailed Analysis or Content Details
The content within each box is a concise phrase representing a specific topic. There is no inherent order or hierarchy implied by the arrangement, although the grid format suggests a deliberate grouping. Each phrase is self-contained and does not appear to reference other boxes directly.
### Key Observations
The topics cover a broad range of organizational and operational concerns, including governance, responsibility, culture, communication, documentation, training, management, and employee onboarding. The inclusion of "Remote work" suggests the topics are relevant to modern workplace dynamics.
### Interpretation
The diagram likely represents a framework for categorizing or addressing different aspects of an organization or project. It could be used for brainstorming, issue tracking, or knowledge management. The topics are interconnected, as effective governance impacts culture, communication influences documentation, and training prepares new employees for remote work. The arrangement suggests these topics are considered equally important or are intended to be explored independently. The diagram doesn't provide any quantitative data or specific relationships between the topics; it serves as a high-level overview of key areas of focus. It is a conceptual map rather than a data-driven visualization.