## Data Tables: Correlation Matrices
### Overview
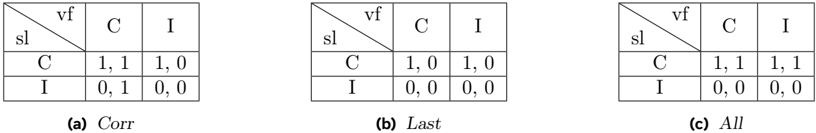
The image presents three data tables, each representing a correlation matrix. Each table is labeled (a) Corr, (b) Last, and (c) All. The tables display relationships between four variables: 'vf', 'C', 'I', and 'sl'. The values within the tables appear to be binary (0 or 1), potentially indicating the presence or absence of a correlation.
### Components/Axes
Each table has the following structure:
- **Rows:** Representing the variables 'sl', 'C', and 'I'.
- **Columns:** Representing the variables 'vf', 'C', and 'I'.
- **Cells:** Containing numerical values (0 or 1) representing the correlation between the corresponding row and column variables.
- **Labels:** Each table is labeled with a descriptive name: "Corr", "Last", and "All".
- **Diagonal:** The diagonal elements are not explicitly labeled, but represent the correlation of a variable with itself.
### Detailed Analysis or Content Details
**Table (a) Corr:**
| | vf | C | I |
|-------|-------|-----|-----|
| **sl** | | | |
| **C** | 1,1 | 1 | 0 |
| **I** | 0,1 | 0 | 0 |
- sl vs vf: Not present
- sl vs C: Not present
- sl vs I: Not present
- C vs vf: 1,1
- C vs C: 1
- C vs I: 0
- I vs vf: 0,1
- I vs C: 0
- I vs I: 0
**Table (b) Last:**
| | vf | C | I |
|-------|-------|-----|-----|
| **sl** | | | |
| **C** | 1,0 | 1 | 0 |
| **I** | 0,0 | 0 | 0 |
- sl vs vf: Not present
- sl vs C: Not present
- sl vs I: Not present
- C vs vf: 1,0
- C vs C: 1
- C vs I: 0
- I vs vf: 0,0
- I vs C: 0
- I vs I: 0
**Table (c) All:**
| | vf | C | I |
|-------|-------|-----|-----|
| **sl** | | | |
| **C** | 1,1 | 1 | 1 |
| **I** | 0,0 | 0 | 0 |
- sl vs vf: Not present
- sl vs C: Not present
- sl vs I: Not present
- C vs vf: 1,1
- C vs C: 1
- C vs I: 1
- I vs vf: 0,0
- I vs C: 0
- I vs I: 0
### Key Observations
- The values in the tables are predominantly 0 or 1.
- The diagonal elements (C vs C, I vs I) are consistently 1 and 0 respectively.
- Table (a) "Corr" and (c) "All" have similar patterns, with the main difference being the value in the C vs I cell.
- Table (b) "Last" shows a different pattern, particularly in the C vs vf cell.
- The values are presented as pairs (e.g., 1,1 or 0,1). This could represent two different correlation measures or confidence levels.
### Interpretation
These tables likely represent the results of a correlation analysis between four variables. The binary values suggest a thresholding process, where correlations above a certain level are represented as 1 and below as 0. The different tables ("Corr", "Last", "All") might represent different subsets of data or different methods of calculating the correlation.
The consistent 1 in the C vs C and 0 in the I vs I cells indicate perfect self-correlation for C and no self-correlation for I. The varying values in other cells suggest different relationships between the variables depending on the table. The paired values (e.g., 1,1) could represent a correlation coefficient and its associated p-value, or two different correlation metrics.
Without further context, it's difficult to determine the specific meaning of these correlations. However, the tables provide a clear visual representation of the relationships between the four variables under different conditions.