## Heatmap: Correlation Matrices (Corr, Last, All)
### Overview
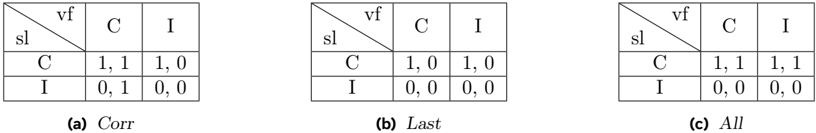
The image contains three side-by-side heatmaps labeled **(a) Corr**, **(b) Last**, and **(c) All**, each representing a 2x2 matrix with rows labeled **sl** and **vf**, and columns labeled **C** and **I**. Numerical values (pairs of integers) are embedded in each cell, suggesting relationships or correlations between variables.
---
### Components/Axes
- **Rows**:
- **sl** (top row)
- **vf** (diagonal label, top-right)
- **Columns**:
- **C** (left column)
- **I** (right column)
- **Values**:
- Each cell contains two integers separated by a comma (e.g., "1, 1", "0, 0").
- **Labels**:
- **(a) Corr**, **(b) Last**, **(c) All** (table titles).
---
### Detailed Analysis
#### Table (a) Corr
| | C | I |
|-------|---------|---------|
| **C** | 1, 1 | 1, 0 |
| **I** | 0, 1 | 0, 0 |
#### Table (b) Last
| | C | I |
|-------|---------|---------|
| **C** | 1, 0 | 1, 0 |
| **I** | 0, 0 | 0, 0 |
#### Table (c) All
| | C | I |
|-------|---------|---------|
| **C** | 1, 1 | 1, 1 |
| **I** | 0, 0 | 0, 0 |
---
### Key Observations
1. **Corr Table**:
- **C row**: Stronger correlation with **C** (1,1) than **I** (1,0).
- **I row**: Weak correlation with **C** (0,1) and no correlation with **I** (0,0).
2. **Last Table**:
- **C row**: Equal correlation with **C** and **I** (1,0).
- **I row**: No correlation with any category (0,0).
3. **All Table**:
- **C row**: Uniform correlation with both **C** and **I** (1,1).
- **I row**: No correlation with any category (0,0).
---
### Interpretation
- **Corr Table**: Suggests **C** and **I** have asymmetric relationships. **C** correlates more strongly with itself than **I**, while **I** shows partial correlation with **C**.
- **Last Table**: Indicates a recent state where **C** had equal influence on both **C** and **I**, but **I** had no influence.
- **All Table**: Represents an aggregated view where **C** consistently correlates with both categories, while **I** remains inert.
- **Trends**:
- **C** dominates in **Corr** and **All** tables, implying it is a central variable.
- **I** only shows activity in **Corr** (partial correlation with **C**), suggesting conditional or secondary influence.
- **Anomalies**:
- The **Last** table’s uniform "1,0" values for **C** may indicate a transitional or simplified state compared to the more nuanced **Corr** and **All** tables.
---
### Technical Notes
- **Data Structure**: All tables follow a 2x2 matrix format with row/column labels and paired integer values.
- **Uncertainty**: Values are exact integers; no decimal approximations are needed.
- **Language**: All text is in English. No non-English content is present.