# Chart Analysis: TL;DR Summarization Win Rate vs Reference
## Title
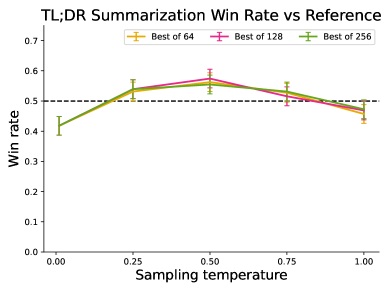
- **Title**: "TL;DR Summarization Win Rate vs Reference"
## Axes
- **X-axis**:
- Label: "Sampling temperature"
- Range: 0.00 to 1.00
- Markers: 0.00, 0.25, 0.50, 0.75, 1.00
- **Y-axis**:
- Label: "Win rate"
- Range: 0.0 to 0.7
- Increment: 0.1
## Legend
- **Best of 64**: Yellow line with error bars
- **Best of 128**: Pink line with error bars
- **Best of 256**: Green line with error bars
## Data Trends
1. **Best of 64 (Yellow)**:
- Starts at ~0.42 win rate at 0.00 sampling temperature.
- Peaks at ~0.55 win rate at 0.50 sampling temperature.
- Declines to ~0.46 win rate at 1.00 sampling temperature.
- Error bars indicate variability (e.g., ±0.03 at peak).
2. **Best of 128 (Pink)**:
- Starts at ~0.42 win rate at 0.00 sampling temperature.
- Peaks at ~0.58 win rate at 0.50 sampling temperature.
- Declines to ~0.48 win rate at 1.00 sampling temperature.
- Error bars indicate variability (e.g., ±0.04 at peak).
3. **Best of 256 (Green)**:
- Starts at ~0.42 win rate at 0.00 sampling temperature.
- Peaks at ~0.56 win rate at 0.50 sampling temperature.
- Declines to ~0.47 win rate at 1.00 sampling temperature.
- Error bars indicate variability (e.g., ±0.03 at peak).
## Key Observations
- All three configurations ("Best of 64", "Best of 128", "Best of 256") show similar trends:
- Win rate increases with sampling temperature up to 0.50.
- Win rate decreases beyond 0.50 sampling temperature.
- **Best of 128** achieves the highest peak win rate (~0.58) at 0.50 sampling temperature.
- **Best of 64** has the lowest peak win rate (~0.55) at 0.50 sampling temperature.
- A dashed horizontal reference line at **0.50 win rate** is present for comparison.
## Error Bars
- Error bars are visible for all lines, indicating measurement variability. Specific values are not quantified in the image but are visually consistent across configurations.
## Summary
The chart illustrates the relationship between sampling temperature and win rate for three summarization configurations. Performance peaks at a sampling temperature of 0.50 across all configurations, with "Best of 128" outperforming the others. Win rates decline symmetrically as sampling temperature moves away from 0.50.