## Diagram: RSD-C and RSD-S
### Overview
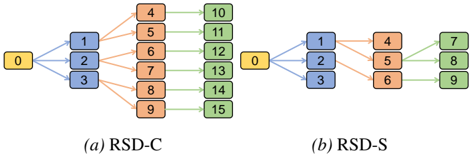
The image presents two diagrams, labeled (a) RSD-C and (b) RSD-S, illustrating different data flow processes. Both diagrams use colored rectangles to represent data points and arrows to indicate the flow of data between them.
### Components/Axes
* **Nodes:** The diagrams consist of rectangular nodes, each containing a numerical value. The nodes are colored yellow, blue, orange, and green.
* **Arrows:** Arrows indicate the direction of data flow between the nodes. The arrows are colored blue, orange, and green, matching the colors of the nodes they connect.
* **Labels:** The diagrams are labeled as "(a) RSD-C" and "(b) RSD-S" at the bottom.
### Detailed Analysis
**(a) RSD-C**
* **Initial Node:** A yellow node labeled "0" is the starting point.
* **First Layer:** The "0" node connects to three blue nodes labeled "1", "2", and "3".
* 0 connects to 1 with a blue arrow.
* 0 connects to 2 with a blue arrow.
* 0 connects to 3 with a blue arrow.
* **Second Layer:** The blue nodes connect to six orange nodes labeled "4", "5", "6", "7", "8", and "9".
* 1 connects to 4 with an orange arrow.
* 1 connects to 5 with an orange arrow.
* 2 connects to 6 with an orange arrow.
* 2 connects to 7 with an orange arrow.
* 3 connects to 8 with an orange arrow.
* 3 connects to 9 with an orange arrow.
* **Third Layer:** The orange nodes connect to six green nodes labeled "10", "11", "12", "13", "14", and "15".
* 4 connects to 10 with a green arrow.
* 5 connects to 11 with a green arrow.
* 6 connects to 12 with a green arrow.
* 7 connects to 13 with a green arrow.
* 8 connects to 14 with a green arrow.
* 9 connects to 15 with a green arrow.
**(b) RSD-S**
* **Initial Node:** A yellow node labeled "0" is the starting point.
* **First Layer:** The "0" node connects to three blue nodes labeled "1", "2", and "3".
* 0 connects to 1 with a blue arrow.
* 0 connects to 2 with a blue arrow.
* 0 connects to 3 with a blue arrow.
* **Second Layer:** The blue nodes connect to three orange nodes labeled "4", "5", and "6".
* 1 connects to 4 with an orange arrow.
* 2 connects to 5 with an orange arrow.
* 3 connects to 6 with an orange arrow.
* **Third Layer:** The orange nodes connect to three green nodes labeled "7", "8", and "9".
* 4 connects to 7 with a green arrow.
* 5 connects to 8 with a green arrow.
* 6 connects to 9 with a green arrow.
### Key Observations
* Both diagrams start with a single yellow node labeled "0".
* Both diagrams have three layers of nodes.
* RSD-C has a branching structure, with the number of nodes increasing in each layer before the final layer.
* RSD-S has a linear structure, with the number of nodes remaining constant after the first layer.
### Interpretation
The diagrams likely represent different data processing or distribution methods. RSD-C appears to be a more complex process, potentially involving parallel processing or data replication. RSD-S seems to be a simpler, more sequential process. The colors may represent different stages or types of data. The diagrams illustrate how an initial data point "0" is transformed or distributed through different stages, resulting in a final set of data points.