## Diagram: RSD-C and RSD-S Flowcharts
### Overview
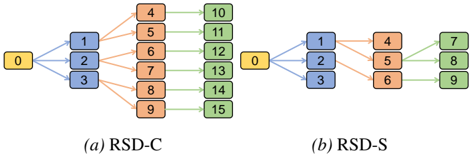
The image displays two side-by-side flowchart diagrams labeled (a) RSD-C and (b) RSD-S. Both diagrams illustrate a hierarchical, directed flow starting from a single source node (labeled "0") and branching through multiple layers of numbered nodes. The nodes are color-coded by layer: yellow for the source, blue for the first layer, orange for the second layer, and green for the final layer. The diagrams appear to represent two different system architectures or data distribution models.
### Components/Axes
* **Diagram (a) RSD-C (Left Side):**
* **Source Node:** Yellow box labeled "0".
* **First Layer (Blue):** Three nodes labeled "1", "2", "3".
* **Second Layer (Orange):** Six nodes labeled "4", "5", "6", "7", "8", "9".
* **Final Layer (Green):** Six nodes labeled "10", "11", "12", "13", "14", "15".
* **Connections (Arrows):** Directed arrows show the flow from source to first layer, from first to second layer, and from second to final layer.
* **Diagram (b) RSD-S (Right Side):**
* **Source Node:** Yellow box labeled "0".
* **First Layer (Blue):** Three nodes labeled "1", "2", "3".
* **Second Layer (Orange):** Three nodes labeled "4", "5", "6".
* **Final Layer (Green):** Three nodes labeled "7", "8", "9".
* **Connections (Arrows):** Directed arrows show the flow from source to first layer, from first to second layer, and from second to final layer.
### Detailed Analysis
**Diagram (a) RSD-C - Connection Topology:**
1. **Source to First Layer:** Node "0" connects to all three blue nodes ("1", "2", "3").
2. **First to Second Layer:**
* Blue node "1" connects to orange nodes "4", "5", "6".
* Blue node "2" connects to orange nodes "7", "8".
* Blue node "3" connects to orange node "9".
3. **Second to Final Layer:** Each orange node connects to exactly one unique green node.
* "4" → "10"
* "5" → "11"
* "6" → "12"
* "7" → "13"
* "8" → "14"
* "9" → "15"
* **Trend/Pattern:** This is a strict, expanding hierarchy. The number of nodes increases at each layer (1 → 3 → 6 → 6). There is no convergence; each path from the source leads to a unique final node.
**Diagram (b) RSD-S - Connection Topology:**
1. **Source to First Layer:** Node "0" connects to all three blue nodes ("1", "2", "3").
2. **First to Second Layer:**
* Blue node "1" connects to orange node "4".
* Blue node "2" connects to orange node "5".
* Blue node "3" connects to orange node "6".
3. **Second to Final Layer:** This layer features convergence, where multiple orange nodes can connect to the same green node.
* Orange node "4" connects to green nodes "7" and "8".
* Orange node "5" connects to green nodes "8" and "9".
* Orange node "6" connects to green node "9".
* **Trend/Pattern:** This is a converging hierarchy. The number of nodes expands and then contracts (1 → 3 → 3 → 3). The key feature is the shared final nodes ("8" and "9"), indicating that different paths through the system can lead to the same outcome.
### Key Observations
1. **Structural Difference:** The primary distinction is in the final layer. RSD-C has a one-to-one mapping from the second to the final layer, resulting in six distinct endpoints. RSD-S has a many-to-one mapping, resulting in only three distinct endpoints, with nodes "8" and "9" each receiving two incoming connections.
2. **Node Count Progression:**
* RSD-C: 1 (Source) → 3 (Blue) → 6 (Orange) → 6 (Green). Total nodes: 16.
* RSD-S: 1 (Source) → 3 (Blue) → 3 (Orange) → 3 (Green). Total nodes: 10.
3. **Spatial Layout:** Both diagrams are arranged horizontally from left (source) to right (final layer). The legend (color coding) is consistent and implicit, defined by the visual grouping of nodes in each horizontal band.
### Interpretation
These diagrams likely model two different strategies for resource distribution, data replication, or task processing in a distributed system.
* **RSD-C (possibly "Replicated System Design - Concurrent" or similar):** Represents a **fan-out** or **scatter** approach. Each initial branch leads to a completely independent set of final resources or tasks. This maximizes parallelism and isolation but requires more total resources (6 final nodes). It could be used for scenarios requiring high redundancy or independent processing paths.
* **RSD-S (possibly "Replicated System Design - Shared" or similar):** Represents a **fan-out/fan-in** or **convergent** approach. While it starts with parallel branches, the final stage involves sharing or consolidation onto common resources (nodes 8 and 9). This is more resource-efficient (only 3 final nodes) and suggests a system where intermediate processing is parallel, but final outputs are aggregated or where multiple paths can utilize the same shared service or storage endpoint. The convergence on nodes 8 and 9 indicates potential points of coordination, dependency, or bottleneck.
The choice between these models involves a trade-off: RSD-C offers resilience and independence at the cost of higher resource usage, while RSD-S offers efficiency and potential for coordination at the cost of introducing shared dependencies in the final stage.