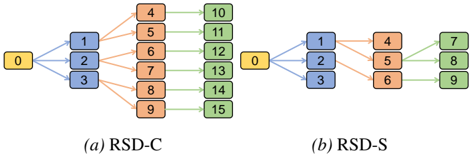
## Diagram: RSD-C and RSD-S Architectures
### Overview
The image depicts two parallel diagrams labeled **(a) RSD-C** and **(b) RSD-S**, representing hierarchical or sequential processes. Both diagrams use color-coded nodes (yellow, blue, orange, green) and directional arrows to illustrate relationships between components.
### Components/Axes
- **Nodes**:
- **Yellow**: Single node labeled `0` (starting point).
- **Blue**: Nodes labeled `1`, `2`, `3` (intermediate layer).
- **Orange**: Nodes labeled `4–9` (RSD-C) and `4–6` (RSD-S).
- **Green**: Nodes labeled `10–15` (RSD-C) and `7–9` (RSD-S).
- **Arrows**:
- **Blue**: Connect `0` to blue nodes (`1–3`).
- **Orange**: Connect blue nodes to orange nodes.
- **Green**: Connect orange nodes to green nodes.
### Detailed Analysis
#### RSD-C (a)
1. **Flow**:
- `0` → `1`, `2`, `3` (blue nodes).
- Each blue node (`1–3`) → three orange nodes (`4–9`).
- Example: Node `1` → `4`, `5`, `6`.
- Each orange node (`4–9`) → three green nodes (`10–15`).
- Example: Node `4` → `10`, `11`, `12`.
2. **Structure**:
- Total nodes: 16 (1 yellow + 3 blue + 6 orange + 6 green).
- Arrows: 3 (blue) + 9 (orange) + 18 (green) = 30 connections.
#### RSD-S (b)
1. **Flow**:
- `0` → `1`, `2`, `3` (blue nodes).
- Each blue node (`1–3`) → three orange nodes (`4–6`).
- Example: Node `1` → `4`, `5`, `6`.
- Each orange node (`4–6`) → three green nodes (`7–9`).
- Example: Node `4` → `7`, `8`, `9`.
2. **Structure**:
- Total nodes: 10 (1 yellow + 3 blue + 3 orange + 3 green).
- Arrows: 3 (blue) + 9 (orange) + 9 (green) = 21 connections.
### Key Observations
1. **Complexity**:
- RSD-C has a longer pathway (3 layers: blue → orange → green) with more nodes and connections.
- RSD-S is streamlined, with fewer nodes and a direct orange → green transition.
2. **Color Coding**:
- Yellow (`0`) is the universal starting point.
- Blue nodes act as intermediaries in both diagrams.
- Orange nodes represent intermediate processing stages.
- Green nodes are terminal outputs.
3. **Spatial Grounding**:
- All diagrams are left-aligned, with RSD-C occupying the left half and RSD-S the right half.
- Arrows flow horizontally and vertically, maintaining consistent directionality.
### Interpretation
- **Purpose**:
- RSD-C likely models a multi-stage process (e.g., data preprocessing → feature extraction → classification), while RSD-S simplifies this into fewer stages.
- **Relationships**:
- Both diagrams share a common starting point (`0`) and intermediary blue nodes, suggesting shared initial steps.
- RSD-S reduces complexity by merging orange and green layers, possibly optimizing for efficiency.
- **Anomalies**:
- RSD-C’s green nodes (`10–15`) are unlabeled beyond numbering, implying generic outputs.
- RSD-S’s green nodes (`7–9`) are similarly unlabeled, suggesting a focus on structural simplicity over granularity.
### Conclusion
The diagrams illustrate two variants of a hierarchical system: RSD-C emphasizes granularity and multi-stage processing, while RSD-S prioritizes simplicity. The use of color-coded nodes and directional arrows highlights modular design principles, with potential applications in workflow automation, data pipelines, or decision-tree modeling.