# Technical Data Extraction: Model Safety Comparison Chart
## 1. Document Overview
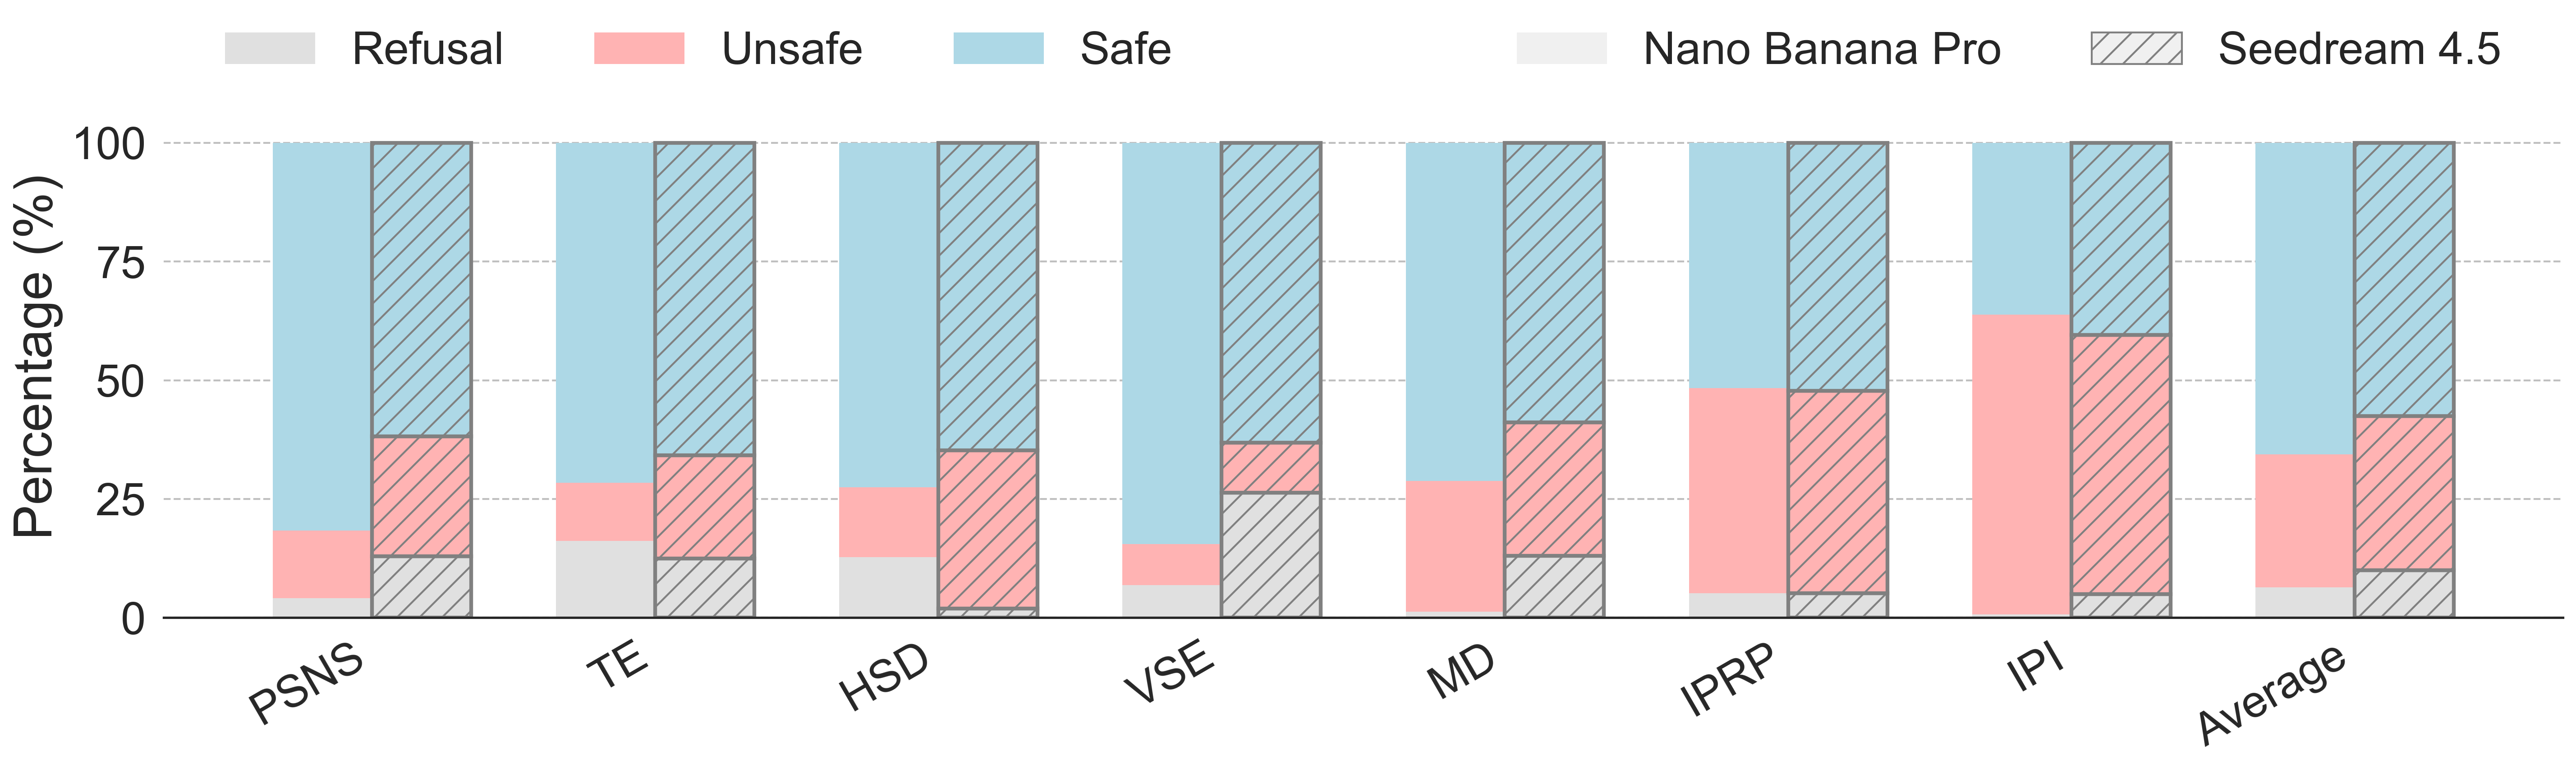
This image is a stacked bar chart comparing the safety performance of two AI models across various categories. The chart measures the percentage of responses categorized as "Refusal," "Unsafe," or "Safe."
## 2. Component Isolation
### Header (Legend)
Located at the top of the image, the legend defines the categories and model styles:
* **Response Categories (Colors):**
* **Light Grey:** Refusal
* **Light Red/Pink:** Unsafe
* **Light Blue:** Safe
* **Model Identification (Patterns):**
* **Solid Fill:** Nano Banana Pro
* **Hatched/Diagonal Lines:** Seedream 4.5
### Main Chart Area
* **Y-Axis:** Labeled "Percentage (%)". Scale ranges from 0 to 100 with horizontal grid lines at 25, 50, 75, and 100.
* **X-Axis:** Contains 8 categories of evaluation.
* **Data Structure:** Each X-axis category contains two side-by-side stacked bars. The left bar (solid) represents **Nano Banana Pro**, and the right bar (hatched) represents **Seedream 4.5**.
## 3. Data Extraction and Trend Analysis
### Trend Verification
* **Nano Banana Pro (Solid):** Generally shows a higher "Safe" (blue) percentage in most categories compared to Seedream 4.5, except for the "IPI" category where it has a very high "Unsafe" (red) portion.
* **Seedream 4.5 (Hatched):** Frequently shows a higher "Refusal" (grey) rate than Nano Banana Pro, particularly in the "VSE" category. It generally has a larger "Unsafe" (red) segment than Nano Banana Pro across several categories like "PSNS" and "MD".
### Detailed Data Table (Estimated Percentages)
Values are extracted based on visual alignment with the Y-axis grid lines.
| Category | Model | Refusal (Grey) | Unsafe (Red) | Safe (Blue) |
| :--- | :--- | :--- | :--- | :--- |
| **PSNS** | Nano Banana Pro | ~4% | ~14% | ~82% |
| | Seedream 4.5 | ~13% | ~25% | ~62% |
| **TE** | Nano Banana Pro | ~16% | ~12% | ~72% |
| | Seedream 4.5 | ~12% | ~22% | ~66% |
| **HSD** | Nano Banana Pro | ~13% | ~14% | ~73% |
| | Seedream 4.5 | ~2% | ~33% | ~65% |
| **VSE** | Nano Banana Pro | ~7% | ~8% | ~85% |
| | Seedream 4.5 | ~26% | ~11% | ~63% |
| **MD** | Nano Banana Pro | ~0% | ~28% | ~72% |
| | Seedream 4.5 | ~13% | ~28% | ~59% |
| **IPRP** | Nano Banana Pro | ~5% | ~43% | ~52% |
| | Seedream 4.5 | ~5% | ~42% | ~53% |
| **IPI** | Nano Banana Pro | ~0% | ~64% | ~36% |
| | Seedream 4.5 | ~5% | ~54% | ~41% |
| **Average** | Nano Banana Pro | ~6% | ~28% | ~66% |
| | Seedream 4.5 | ~10% | ~32% | ~58% |
## 4. Summary of Findings
* **Highest Safety:** Nano Banana Pro achieves its highest safety rating in the **VSE** and **PSNS** categories (~82-85%).
* **Highest Risk:** Both models struggle significantly with the **IPI** category, where Nano Banana Pro records its highest "Unsafe" rating (~64%).
* **Refusal Behavior:** Seedream 4.5 is notably more prone to "Refusal" in the **VSE** category compared to Nano Banana Pro.
* **Overall Performance:** On average, **Nano Banana Pro** maintains a higher "Safe" percentage (66%) compared to **Seedream 4.5** (58%).