## Line Chart: Proportion of Bitwise Reproducible Packages
### Overview
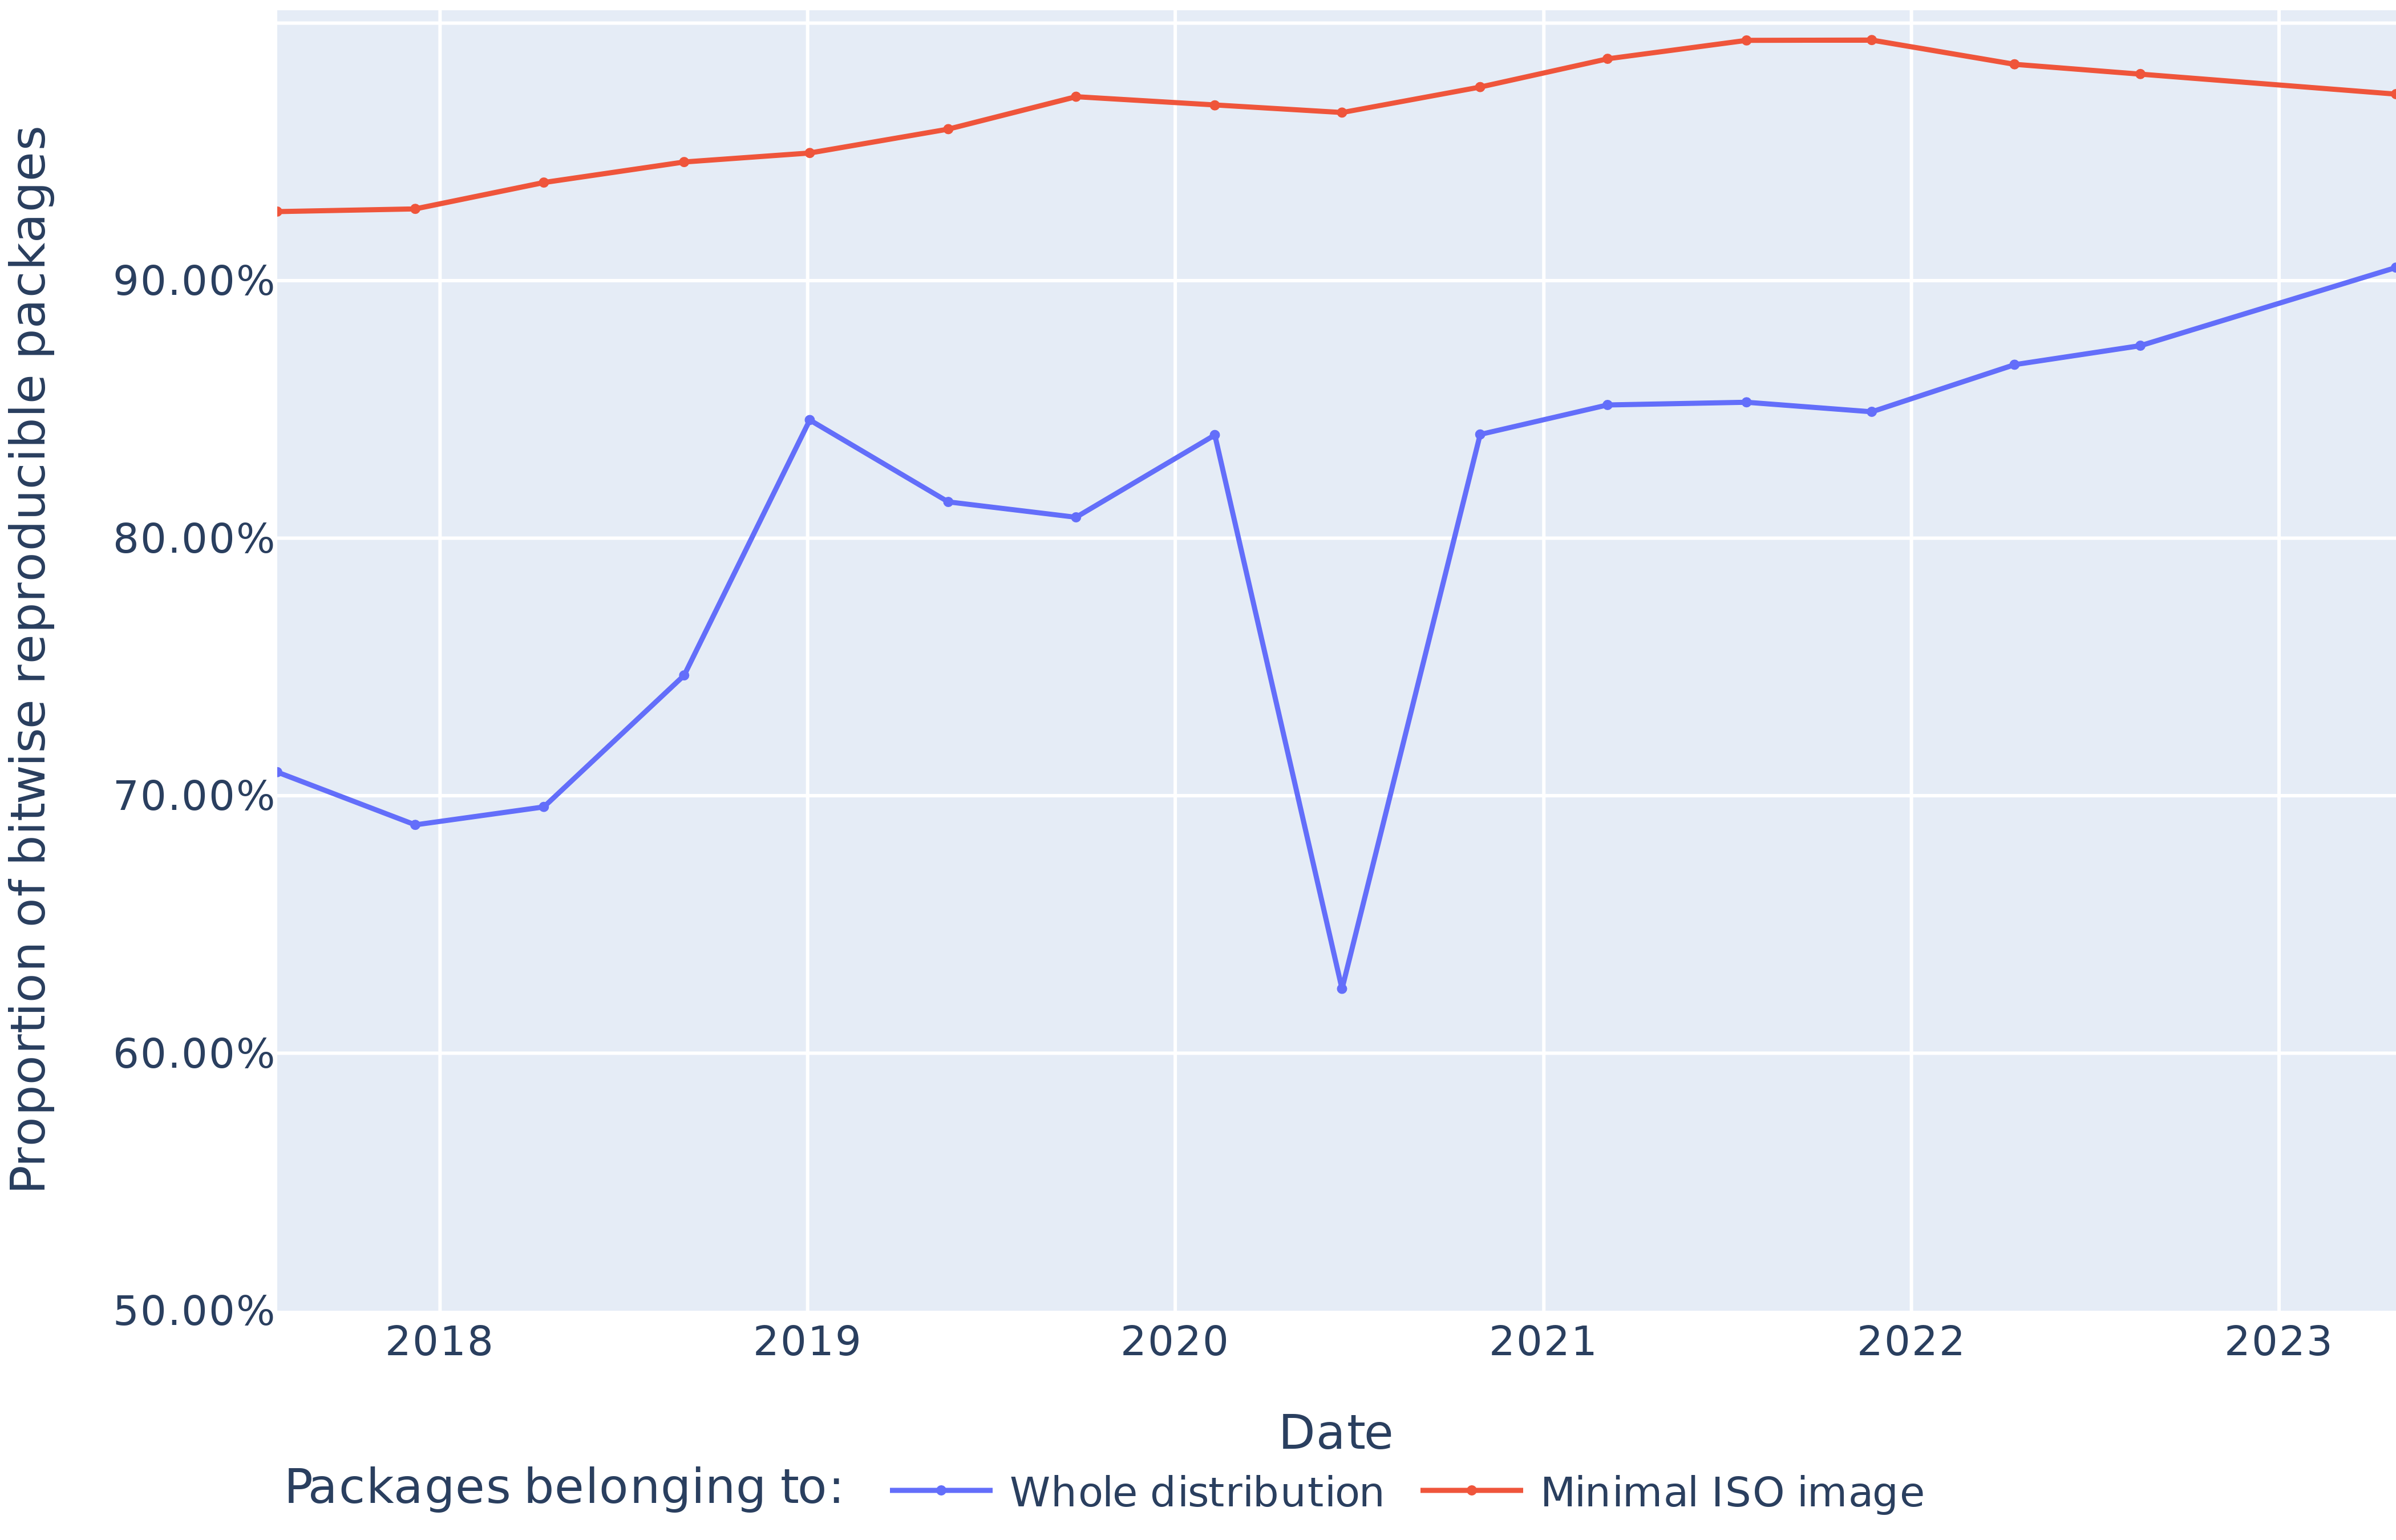
The image is a line chart comparing the proportion of bitwise reproducible packages over time for two categories: "Whole distribution" and "Minimal ISO image". The x-axis represents the date, ranging from 2018 to 2023. The y-axis represents the proportion of bitwise reproducible packages, ranging from 50.00% to 90.00%.
### Components/Axes
* **Title (Y-Axis):** "Proportion of bitwise reproducible packages" (vertical, left side)
* **Title (X-Axis):** "Date" (horizontal, bottom)
* **X-Axis Markers:** 2018, 2019, 2020, 2021, 2022, 2023
* **Y-Axis Markers:** 50.00%, 60.00%, 70.00%, 80.00%, 90.00%
* **Legend:** Located at the bottom of the chart.
* **Blue Line:** "Whole distribution"
* **Red Line:** "Minimal ISO image"
* **Chart Background:** Light blue grid
### Detailed Analysis
**1. Minimal ISO Image (Red Line):**
* **Trend:** Generally increasing, with slight fluctuations.
* **Data Points:**
* 2018: Approximately 92.5%
* 2019: Approximately 93.5%
* 2020: Approximately 95.5%
* 2021: Approximately 95%
* 2022: Approximately 97%
* 2023: Approximately 96%
**2. Whole Distribution (Blue Line):**
* **Trend:** More volatile than the "Minimal ISO image" line, with an overall upward trend, but with a significant dip in 2020.
* **Data Points:**
* 2018: Approximately 70%
* 2019: Approximately 70%
* 2020: Approximately 85%
* 2021: Approximately 81%
* 2022: Approximately 62%
* 2023: Approximately 85%
### Key Observations
* The "Minimal ISO image" consistently has a higher proportion of bitwise reproducible packages than the "Whole distribution".
* The "Whole distribution" experiences a notable drop in reproducibility around 2020, followed by a recovery.
* Both categories show an overall trend of increasing reproducibility over the years.
### Interpretation
The chart suggests that the "Minimal ISO image" benefits from a more controlled environment, leading to higher reproducibility rates compared to the "Whole distribution." The dip in the "Whole distribution" around 2020 could be attributed to changes in the build process, dependencies, or other factors affecting reproducibility. The overall upward trend in both categories indicates ongoing efforts to improve the reproducibility of packages. The difference between the two lines highlights the impact of the scope and complexity of the package set on reproducibility.