\n
## Line Chart: Bitwise Reproducible Packages Over Time
### Overview
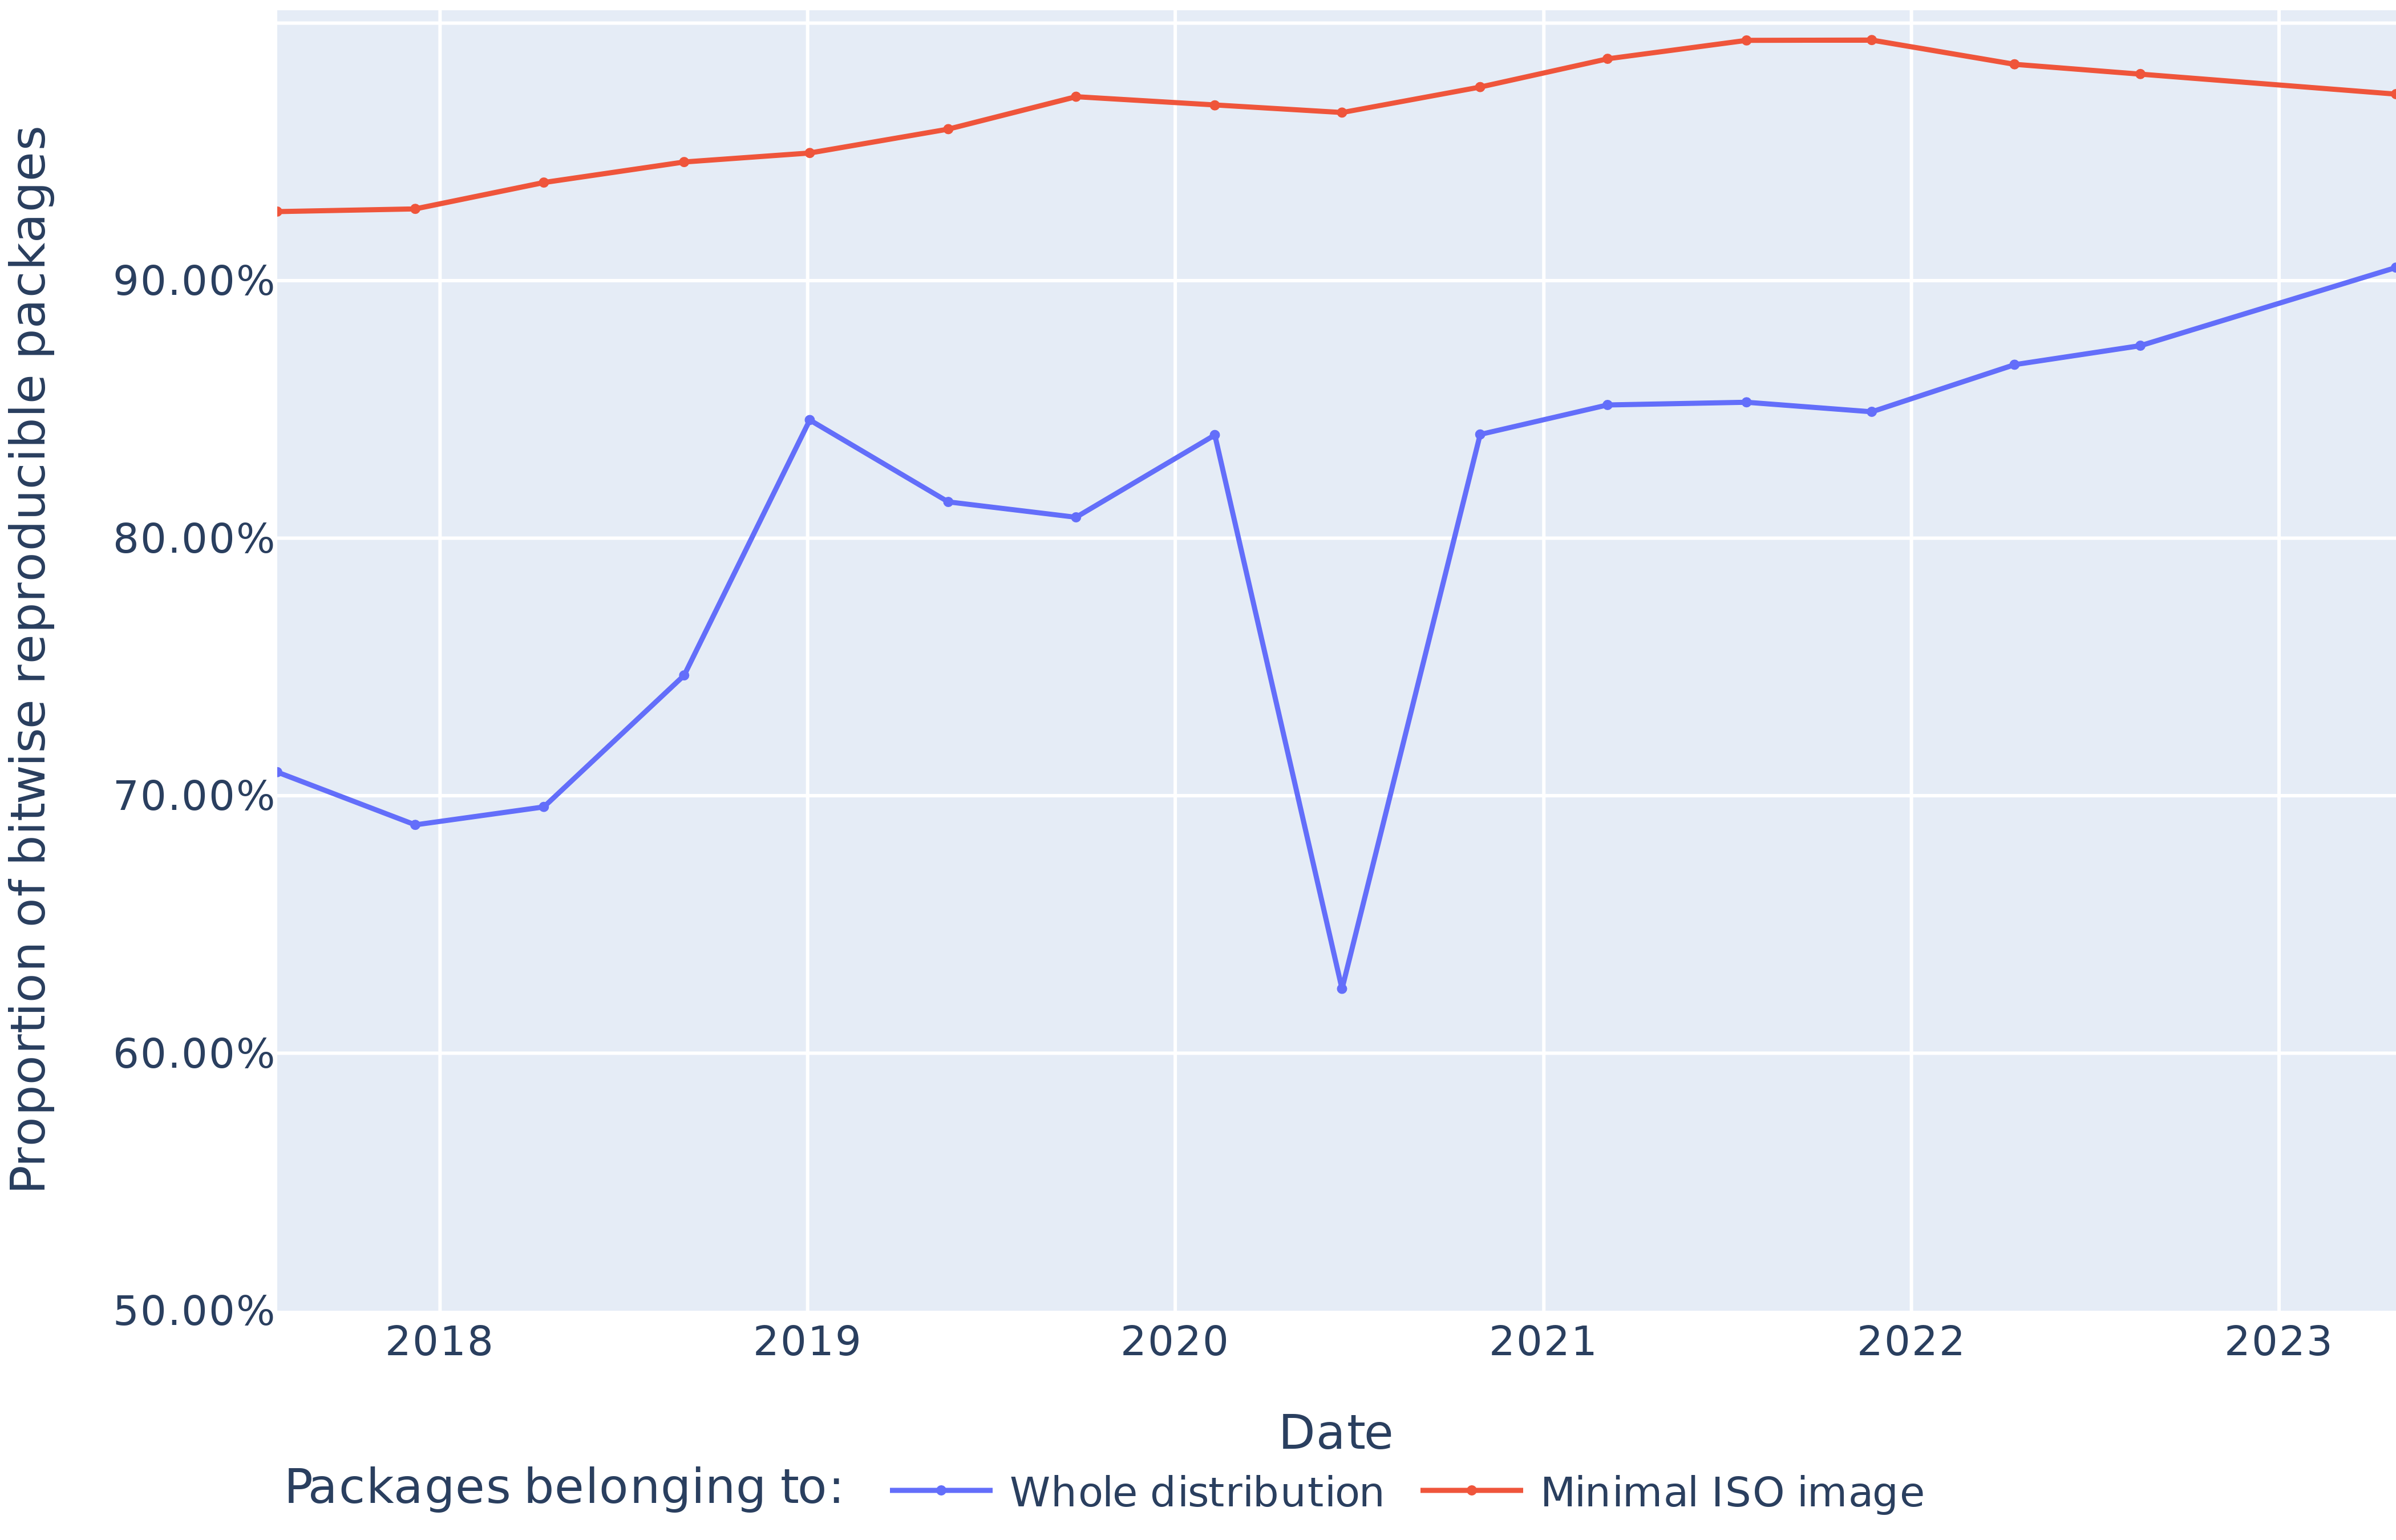
The image presents a line chart illustrating the proportion of bitwise reproducible packages over time, from 2018 to 2023. Two data series are displayed: one representing the "Whole distribution" and the other representing the "Minimal ISO image". The chart aims to show the trend of reproducibility for software packages within these two contexts.
### Components/Axes
* **X-axis:** Labeled "Date", ranging from 2018 to 2023. The axis is linearly scaled.
* **Y-axis:** Labeled "Proportion of bitwise reproducible packages", ranging from 50.00% to 100.00%. The axis is linearly scaled.
* **Legend:** Located at the bottom-center of the chart. It identifies the two data series:
* "Whole distribution" - represented by a blue line.
* "Minimal ISO image" - represented by an orange/red line.
* **Gridlines:** A light blue grid is present to aid in reading values.
### Detailed Analysis
**Whole Distribution (Blue Line):**
The blue line exhibits a generally upward trend, but with significant fluctuations.
* **2018:** Approximately 71% (± 2%).
* **2019:** Approximately 84% (± 2%).
* **2020:** Approximately 82% (± 2%).
* **2021:** Approximately 84% (± 2%).
* **2022:** Approximately 87% (± 2%).
* **2023:** Approximately 91% (± 2%).
**Minimal ISO Image (Orange/Red Line):**
The orange/red line shows a relatively stable and slightly increasing trend.
* **2018:** Approximately 91% (± 1%).
* **2019:** Approximately 92% (± 1%).
* **2020:** Approximately 92% (± 1%).
* **2021:** Approximately 92% (± 1%).
* **2022:** Approximately 93% (± 1%).
* **2023:** Approximately 93% (± 1%).
### Key Observations
* The "Minimal ISO image" consistently demonstrates a higher proportion of bitwise reproducible packages compared to the "Whole distribution" throughout the observed period.
* The "Whole distribution" shows a more volatile trend, with a noticeable dip around 2020.
* Both data series show an overall increasing trend in reproducibility from 2018 to 2023.
* The difference in reproducibility between the two distributions appears to be relatively constant, around 8-10 percentage points.
### Interpretation
The data suggests that while both the whole distribution and the minimal ISO image are becoming more reproducible over time, the minimal ISO image consistently achieves a higher level of reproducibility. This could be due to the reduced complexity and dependencies within the minimal ISO image, making it easier to ensure bitwise consistency. The fluctuations in the "Whole distribution" may be attributed to changes in the package ecosystem, build processes, or dependency management practices. The overall upward trend for both distributions indicates progress in improving software reproducibility, which is crucial for ensuring the reliability and verifiability of software builds and deployments. The dip in 2020 for the "Whole distribution" warrants further investigation to identify the underlying causes. The consistent gap between the two lines suggests that minimizing dependencies and complexity is a key factor in achieving high reproducibility.