## Screenshot: Textual Analysis with Visual Context
### Overview
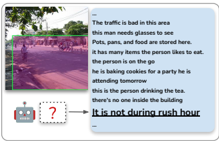
The image is a screenshot featuring two primary components:
1. A **photograph** of an outdoor scene with a **green bounding box** highlighting a person.
2. A **text box** containing nine statements, some crossed out, with one sentence highlighted and underlined.
A **robot icon** with a question mark is positioned at the bottom left, connected by an arrow to the highlighted text.
---
### Components/Axes
#### Photograph
- **Subject**: Outdoor environment with trees, a road, and a person (highlighted in green).
- **Details**: No explicit labels or axis markers.
#### Text Box
- **Content**: Nine statements (see below).
- **Formatting**:
- First eight statements are **crossed out**.
- Ninth statement ("It is not during rush hour") is **highlighted and underlined**.
#### Robot Icon
- **Design**: Gray robot with red accents, question mark symbol.
- **Position**: Bottom-left corner, connected via arrow to the highlighted text.
---
### Detailed Analysis
#### Text Box Content
1. **Crossed-out statements**:
- "The traffic is bad in this area"
- "this man needs glasses to see"
- "Pots, pans, and food are stored here"
- "it has many items the person likes to eat"
- "the person is on the go"
- "he is baking cookies for a party he is attending tomorrow"
- "this is the person drinking the tea"
- "there's no one inside the building"
2. **Highlighted statement**:
- "It is not during rush hour" (underlined, connected to robot icon).
#### Spatial Relationships
- The **robot icon** (bottom-left) points to the highlighted text via an arrow.
- The **green bounding box** in the photograph isolates a person, suggesting relevance to the text.
---
### Key Observations
1. **Contradictory Statements**:
- The first eight statements describe scenarios (e.g., traffic, cooking, tea-drinking) that are **crossed out**, implying they are incorrect or irrelevant.
- The ninth statement ("It is not during rush hour") is emphasized, suggesting it is the correct or critical conclusion.
2. **Robot Icon**:
- The question mark implies uncertainty or a query, directing attention to the highlighted text as the answer.
3. **Photograph Context**:
- The green box around the person may indicate a focus on their activity, but no explicit link to the text is provided.
---
### Interpretation
- The **highlighted statement** ("It is not during rush hour") likely resolves a contradiction among the crossed-out scenarios. For example:
- If it were rush hour, traffic would be bad (contradicting the first statement).
- The person’s activity (e.g., baking cookies, drinking tea) might align with non-rush-hour behavior.
- The **robot icon** acts as a "verifier," signaling that the highlighted text is the correct inference.
- The **photograph** provides visual context but lacks direct textual correlation, leaving the relationship between the image and text ambiguous.
---
### Conclusion
The image appears to be part of a **problem-solving or quiz interface**, where the robot icon poses a question, and the text box presents hypotheses. The highlighted statement ("It is not during rush hour") is the validated answer, supported by the elimination of other scenarios. The photograph’s role remains unclear without additional context.