## Diagram: Rollout-Buffer-Training Synchronization
### Overview
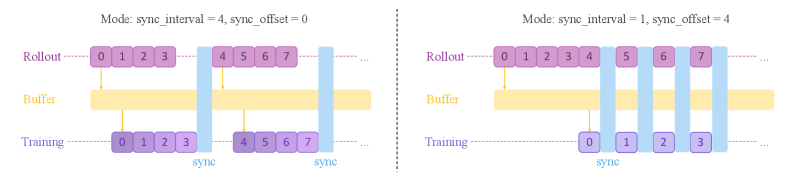
The image presents two diagrams illustrating different synchronization modes between "Rollout," "Buffer," and "Training" processes. The diagrams depict how data segments are synchronized based on "sync_interval" and "sync_offset" parameters. The left diagram shows a mode with `sync_interval = 4` and `sync_offset = 0`, while the right diagram shows a mode with `sync_interval = 1` and `sync_offset = 4`.
### Components/Axes
* **Labels:**
* "Rollout" (purple text, top)
* "Buffer" (yellow text, middle)
* "Training" (purple text, bottom)
* "sync" (blue text, bottom)
* **Parameters (Top):**
* Left: "Mode: sync\_interval = 4, sync\_offset = 0"
* Right: "Mode: sync\_interval = 1, sync\_offset = 4"
* **Data Segments:** Represented as purple boxes with numerical indices (0-7).
* **Synchronization Points:** Represented as vertical blue bars labeled "sync."
* **Flow Direction:** Represented by yellow arrows pointing from Rollout to Buffer and from Buffer to Training.
### Detailed Analysis
**Left Diagram: sync\_interval = 4, sync\_offset = 0**
* **Rollout:** Contains data segments indexed from 0 to 7, arranged sequentially.
* **Buffer:** A horizontal yellow bar representing the buffer.
* **Training:** Contains data segments indexed from 0 to 7, arranged sequentially.
* **Synchronization:**
* The first "sync" bar aligns data segments 0-3 in Rollout and Training.
* The second "sync" bar aligns data segments 4-7 in Rollout and Training.
* The yellow arrows indicate the flow of data from Rollout to Buffer and then to Training.
**Right Diagram: sync\_interval = 1, sync\_offset = 4**
* **Rollout:** Contains data segments indexed from 0 to 7, arranged sequentially.
* **Buffer:** A horizontal yellow bar representing the buffer.
* **Training:** Contains data segments indexed from 0 to 3.
* **Synchronization:**
* The first "sync" bar aligns data segment 0 in Rollout with data segment 0 in Training.
* The second "sync" bar aligns data segment 1 in Rollout with data segment 1 in Training.
* The third "sync" bar aligns data segment 2 in Rollout with data segment 2 in Training.
* The fourth "sync" bar aligns data segment 3 in Rollout with data segment 3 in Training.
* The yellow arrows indicate the flow of data from Rollout to Buffer and then to Training.
### Key Observations
* The `sync_interval` parameter determines how many data segments are grouped together during synchronization.
* The `sync_offset` parameter seems to influence the starting point of the synchronization relative to the Rollout data.
* In the left diagram, the entire Rollout (0-7) is synchronized in two large chunks.
* In the right diagram, the Rollout is synchronized in smaller, individual segments.
* The Training data in the right diagram only contains segments 0-3, suggesting a different processing strategy compared to the left diagram.
### Interpretation
The diagrams illustrate two different approaches to synchronizing data between a "Rollout" process (likely generating data), a "Buffer" (likely storing data temporarily), and a "Training" process (likely consuming data for model training).
The left diagram (sync\_interval = 4, sync\_offset = 0) suggests a batch-oriented synchronization, where larger chunks of data are synchronized at once. This might be suitable for scenarios where training benefits from processing data in larger batches.
The right diagram (sync\_interval = 1, sync\_offset = 4) suggests a more granular, potentially online synchronization, where individual data segments are synchronized. The `sync_offset = 4` indicates that the training process starts with the 4th element of the rollout. This might be suitable for scenarios where training needs to adapt quickly to new data or where resources are limited, and processing smaller segments is more efficient.
The choice of synchronization mode likely depends on the specific requirements of the application, such as the size of the dataset, the training algorithm, and the available computational resources.