\n
## Diagram: Synchronization Modes
### Overview
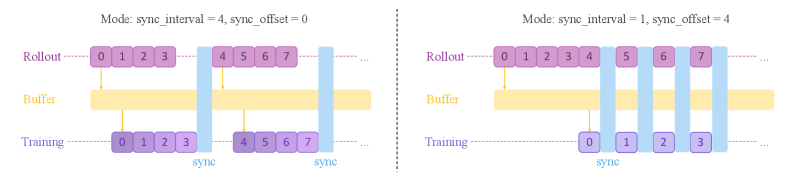
The image presents a diagram illustrating two different synchronization modes for a system involving "Rollout", "Buffer", and "Training" components. Each mode is defined by a `sync_interval` and `sync_offset` parameter. The diagram visually represents how data flows and synchronizes between these components under each mode.
### Components/Axes
The diagram consists of three horizontal components:
* **Rollout:** Represented by a row of numbered boxes (0-7).
* **Buffer:** Represented by a long yellow bar.
* **Training:** Represented by a row of numbered boxes (0-7 in the left diagram, 0-3 in the right diagram).
Vertical blue bars indicate synchronization points. The diagram is split into two sections, each representing a different mode:
* **Mode 1:** `sync_interval = 4`, `sync_offset = 0`
* **Mode 2:** `sync_interval = 1`, `sync_offset = 4`
The text "sync" is written below the synchronization points.
### Detailed Analysis or Content Details
**Mode 1: `sync_interval = 4`, `sync_offset = 0`**
* **Rollout:** Boxes numbered 0 through 7 are shown.
* **Buffer:** A long yellow bar spans the width of the diagram.
* **Training:** Boxes numbered 0 through 7 are shown.
* **Synchronization:** Two vertical blue bars are present. The first synchronizes boxes 0, 1, 2, and 3 in Rollout with boxes 0, 1, 2, and 3 in Training. The second synchronizes boxes 4, 5, 6, and 7 in Rollout with boxes 4, 5, 6, and 7 in Training.
**Mode 2: `sync_interval = 1`, `sync_offset = 4`**
* **Rollout:** Boxes numbered 0 through 7 are shown.
* **Buffer:** A long yellow bar spans the width of the diagram.
* **Training:** Boxes numbered 0 through 3 are shown.
* **Synchronization:** Five vertical blue bars are present. The synchronization points are at boxes 0, 1, 2, and 3 in Rollout with boxes 0, 1, 2, and 3 in Training. The fifth synchronization point is at box 4 in Rollout.
### Key Observations
* The `sync_interval` determines how frequently synchronization occurs. A smaller `sync_interval` (Mode 2) results in more frequent synchronization.
* The `sync_offset` determines the starting point for synchronization.
* The number of boxes in the Training component differs between the two modes. Mode 1 has 8 boxes, while Mode 2 has 4.
* The Buffer component appears to act as a temporary storage or delay mechanism.
### Interpretation
The diagram illustrates different strategies for synchronizing data between a rollout process and a training process. The `sync_interval` and `sync_offset` parameters control the granularity and timing of this synchronization.
Mode 1, with a larger `sync_interval` and zero offset, performs synchronization less frequently, potentially reducing overhead but increasing the risk of divergence between the rollout and training data.
Mode 2, with a smaller `sync_interval` and a non-zero offset, performs synchronization more frequently, potentially reducing divergence but increasing overhead. The reduced number of boxes in the Training component suggests that the training process may be truncated or operate on a smaller subset of the rollout data in this mode.
The Buffer component likely serves to smooth out the data flow and accommodate the differences in synchronization frequency between the two modes. The diagram suggests a trade-off between synchronization frequency, computational overhead, and the amount of data used for training. The choice of synchronization mode would depend on the specific requirements of the application and the characteristics of the data.