## Diagram: Synchronization Mode Visualization
### Overview
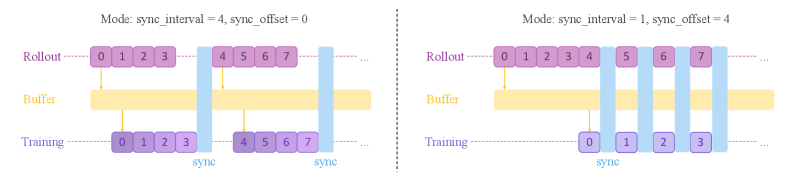
The image contains two side-by-side diagrams comparing synchronization modes in a system. Each diagram illustrates three horizontal sections labeled **Rollout**, **Buffer**, and **Training**, with vertical "sync" markers indicating synchronization points. The diagrams differ in their `sync_interval` and `sync_offset` parameters, affecting the alignment of sections.
### Components/Axes
- **Sections**:
- **Rollout**: Purple blocks with sequential numbering (e.g., 0, 1, 2, 3).
- **Buffer**: Yellow blocks spanning the full width of each diagram.
- **Training**: Blue blocks with sequential numbering (e.g., 0, 1, 2, 3).
- **Vertical Markers**: Labeled "sync" to denote synchronization points.
- **Parameters**:
- **Left Diagram**: `sync_interval = 4`, `sync_offset = 0`.
- **Right Diagram**: `sync_interval = 1`, `sync_offset = 4`.
### Detailed Analysis
#### Left Diagram (`sync_interval = 4`, `sync_offset = 0`)
- **Rollout**: Blocks 0–3 (purple) align with **Training** blocks 0–3 (blue) at the first sync point (x=4).
- **Buffer**: Spans the entire width, acting as a continuous layer.
- **Training**: Blocks 0–3 (blue) align with Rollout at x=4. Subsequent sync points occur every 4 units (x=8, x=12, etc.).
#### Right Diagram (`sync_interval = 1`, `sync_offset = 4`)
- **Rollout**: Blocks 0–4 (purple) extend beyond the first sync point (x=1).
- **Training**: Blocks 0–3 (blue) align with Rollout at x=4 (offset by 4 units).
- **Sync Frequency**: Sync markers appear every 1 unit, but the offset causes misalignment between Rollout and Training sections.
### Key Observations
1. **Alignment**:
- Left diagram shows perfect alignment between Rollout and Training at sync points due to `sync_offset = 0`.
- Right diagram’s `sync_offset = 4` creates a phase shift, delaying alignment between sections.
2. **Sync Interval Impact**:
- Larger `sync_interval` (4) reduces sync frequency, creating longer uninterrupted sections.
- Smaller `sync_interval` (1) increases sync frequency but introduces misalignment due to offset.
3. **Buffer Role**: The Buffer section remains uninterrupted in both diagrams, suggesting it acts as a stabilizing layer.
### Interpretation
The diagrams demonstrate how synchronization parameters (`sync_interval` and `sync_offset`) influence system behavior:
- **Left Diagram**: Optimal alignment for coordinated operations (e.g., training and rollout phases).
- **Right Diagram**: Frequent syncs with offset may lead to inefficiencies or conflicts between sections.
- **Buffer Function**: Likely serves as a decoupling layer to absorb variability between Rollout and Training phases.
The visual trends confirm that synchronization strategy directly impacts system stability and resource utilization.