## Collection of Charts: Rendered Code
### Overview
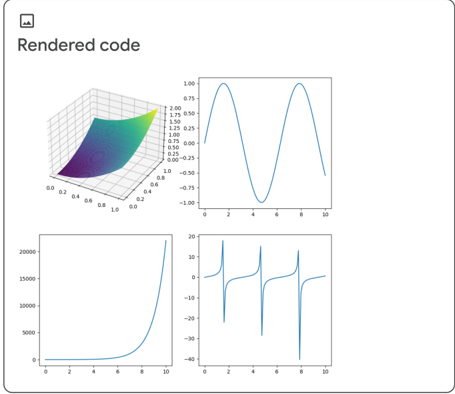
The image displays four charts arranged in a 2x2 grid. The top-left chart is a 3D surface plot, the top-right is a sine wave, the bottom-left shows exponential growth, and the bottom-right displays a tangent function. All charts share a similar x-axis range, while the y-axis scales vary significantly.
### Components/Axes
**Top-Left Chart (3D Surface Plot):**
* **Axes:** x-axis ranges from 0 to 1, y-axis ranges from 0 to 1, z-axis ranges from approximately 0 to 2.
* **Surface:** The surface is colored with a gradient, transitioning from purple/blue at the origin to yellow at the opposite corner.
* **Labels:** No explicit axis labels are present.
**Top-Right Chart (Sine Wave):**
* **X-axis:** Ranges from 0 to 10.
* **Y-axis:** Ranges from -1.0 to 1.0, with markers at -0.75, -0.50, -0.25, 0.00, 0.25, 0.50, 0.75, and 1.00.
* **Data Series:** A blue sine wave with a period of approximately 6.
**Bottom-Left Chart (Exponential Growth):**
* **X-axis:** Ranges from 0 to 10.
* **Y-axis:** Ranges from 0 to 20000, with markers at 0, 5000, 10000, 15000, and 20000.
* **Data Series:** A blue line showing exponential growth, starting near 0 and rapidly increasing towards 20000 as x approaches 10.
**Bottom-Right Chart (Tangent Function):**
* **X-axis:** Ranges from 0 to 10.
* **Y-axis:** Ranges from -40 to 20, with markers at -40, -30, -20, -10, 0, 10, and 20.
* **Data Series:** A blue tangent function with asymptotes.
### Detailed Analysis
**Top-Left Chart (3D Surface Plot):**
* The surface appears to be a quadratic function, curving upwards from the origin.
* The color gradient indicates the height of the surface, with yellow representing the highest points.
**Top-Right Chart (Sine Wave):**
* The sine wave starts at y=0 when x=0.
* The first peak occurs at approximately x=1.5, reaching y=1.
* The first trough occurs at approximately x=4.5, reaching y=-1.
* The wave completes one full cycle by approximately x=7.
**Bottom-Left Chart (Exponential Growth):**
* The curve is relatively flat for x values between 0 and 6.
* The curve increases sharply for x values between 6 and 10.
* At x=10, the y-value is approximately 21000.
**Bottom-Right Chart (Tangent Function):**
* The function has vertical asymptotes.
* The function repeats its pattern.
### Key Observations
* The charts represent different types of mathematical functions.
* The x-axis range is consistent across all charts, allowing for a visual comparison of function behavior over the same domain.
* The y-axis scales vary significantly, reflecting the different ranges of values produced by each function.
### Interpretation
The image presents a visual comparison of four different mathematical functions: a 3D quadratic surface, a sine wave, an exponential function, and a tangent function. The consistent x-axis allows for a direct comparison of how each function behaves over the same input range. The varying y-axis scales highlight the different magnitudes of the outputs produced by each function. The image likely serves as a demonstration of these functions, possibly generated by code as indicated by the title "Rendered code".