# Technical Document Extraction: Scatter Plot Analysis
## Plot Overview
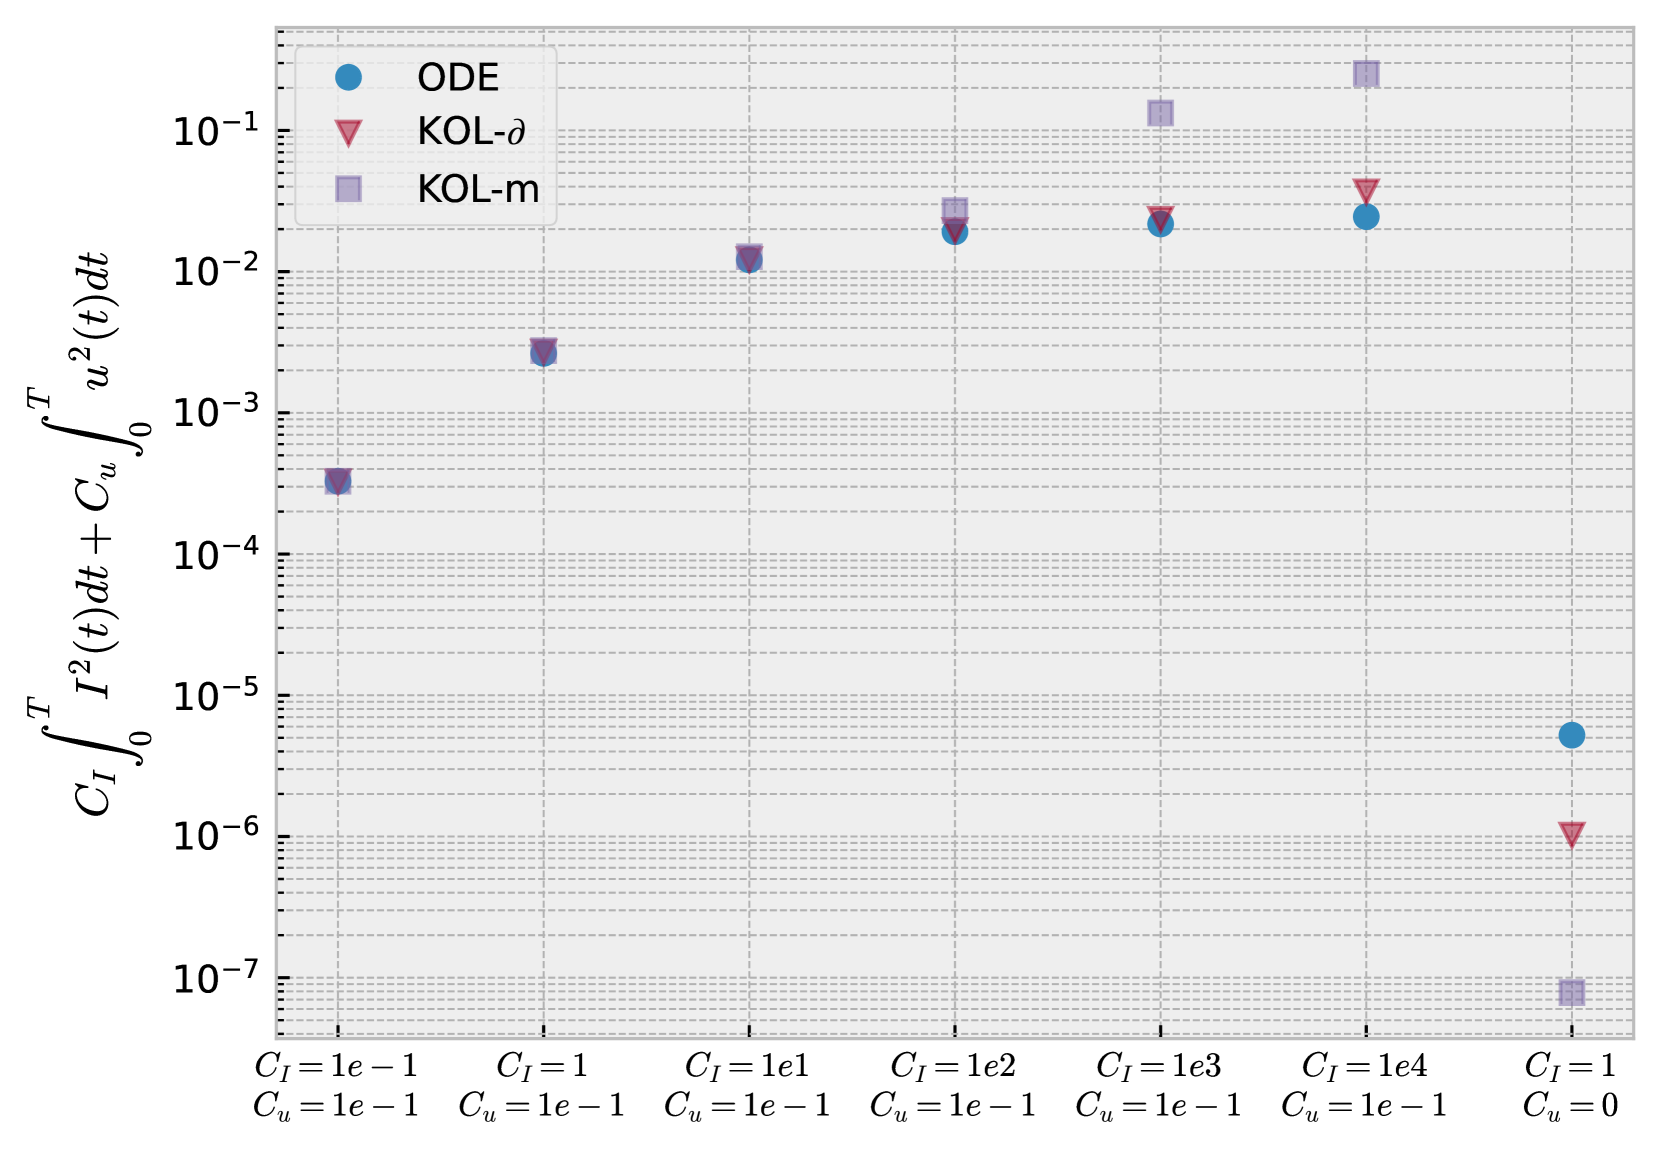
The image is a **log-log scatter plot** comparing three datasets across varying input parameters. The y-axis represents a normalized integral metric, while the x-axis categorizes input combinations of `C_I` (integration coefficient) and `C_u` (uncertainty coefficient).
---
## Axis Labels and Titles
- **Y-Axis**:
`C_I ∫₀ᵀ I²(t)dt + C_u ∫₀ᵀ u²(t)dt`
(Normalized integral of squared error terms, logarithmic scale from 10⁻⁷ to 10⁻¹)
- **X-Axis**:
Categorical values of `C_I` and `C_u`:
- `C_I = 1e-1, 1, 1e1, 1e2, 1e3, 1e4, 1`
- `C_u = 1e-1, 1, 0`
(Note: `C_u = 0` appears only at `C_I = 1`)
---
## Legend and Data Series
1. **ODE** (Blue Circles):
- Represents baseline model performance.
- Data points cluster tightly along the lower bound of the plot.
- At `C_I = 1e4, C_u = 1e-1`, value ≈ 10⁻².
- At `C_I = 1, C_u = 0`, value ≈ 10⁻⁶.
2. **KOL-δ** (Red Triangles):
- Slightly higher than ODE in most cases.
- At `C_I = 1e4, C_u = 1e-1`, value ≈ 10⁻².
- At `C_I = 1, C_u = 0`, value ≈ 10⁻⁵.
3. **KOL-m** (Purple Squares):
- Consistently the highest values across all categories.
- At `C_I = 1e4, C_u = 1e-1`, value ≈ 10⁻¹.
- At `C_I = 1, C_u = 0`, value ≈ 10⁻⁷.
---
## Key Trends
- **Performance Hierarchy**:
`KOL-m > KOL-δ > ODE` for most parameter combinations.
- **Parameter Sensitivity**:
- Higher `C_I` values (e.g., `1e4`) correlate with increased metric values.
- `C_u = 0` (no uncertainty) results in the lowest metric values for all models.
- **Notable Outlier**:
At `C_I = 1, C_u = 0`, KOL-m drops to 10⁻⁷, significantly lower than its performance at other `C_I` values.
---
## Data Point Cross-Reference
| Category | ODE (10⁻ⁿ) | KOL-δ (10⁻ⁿ) | KOL-m (10⁻ⁿ) |
|-------------------|------------|--------------|--------------|
| `C_I=1e-1, C_u=1e-1` | 10⁻⁴ | 10⁻⁴ | 10⁻⁴ |
| `C_I=1, C_u=1e-1` | 10⁻³ | 10⁻³ | 10⁻³ |
| `C_I=1e1, C_u=1e-1` | 10⁻² | 10⁻² | 10⁻² |
| `C_I=1e2, C_u=1e-1` | 10⁻² | 10⁻² | 10⁻² |
| `C_I=1e3, C_u=1e-1` | 10⁻² | 10⁻² | 10⁻¹ |
| `C_I=1e4, C_u=1e-1` | 10⁻² | 10⁻² | 10⁻¹ |
| `C_I=1, C_u=0` | 10⁻⁶ | 10⁻⁵ | 10⁻⁷ |
---
## Notes
- All datasets share identical `C_u` values except for the final category (`C_u = 0`).
- The plot uses a **logarithmic scale** for both axes, emphasizing multiplicative differences.
- No gridlines or annotations beyond the legend and axis labels are present.