## Line Chart: Test AUROC Performance Across Model Layers
### Overview
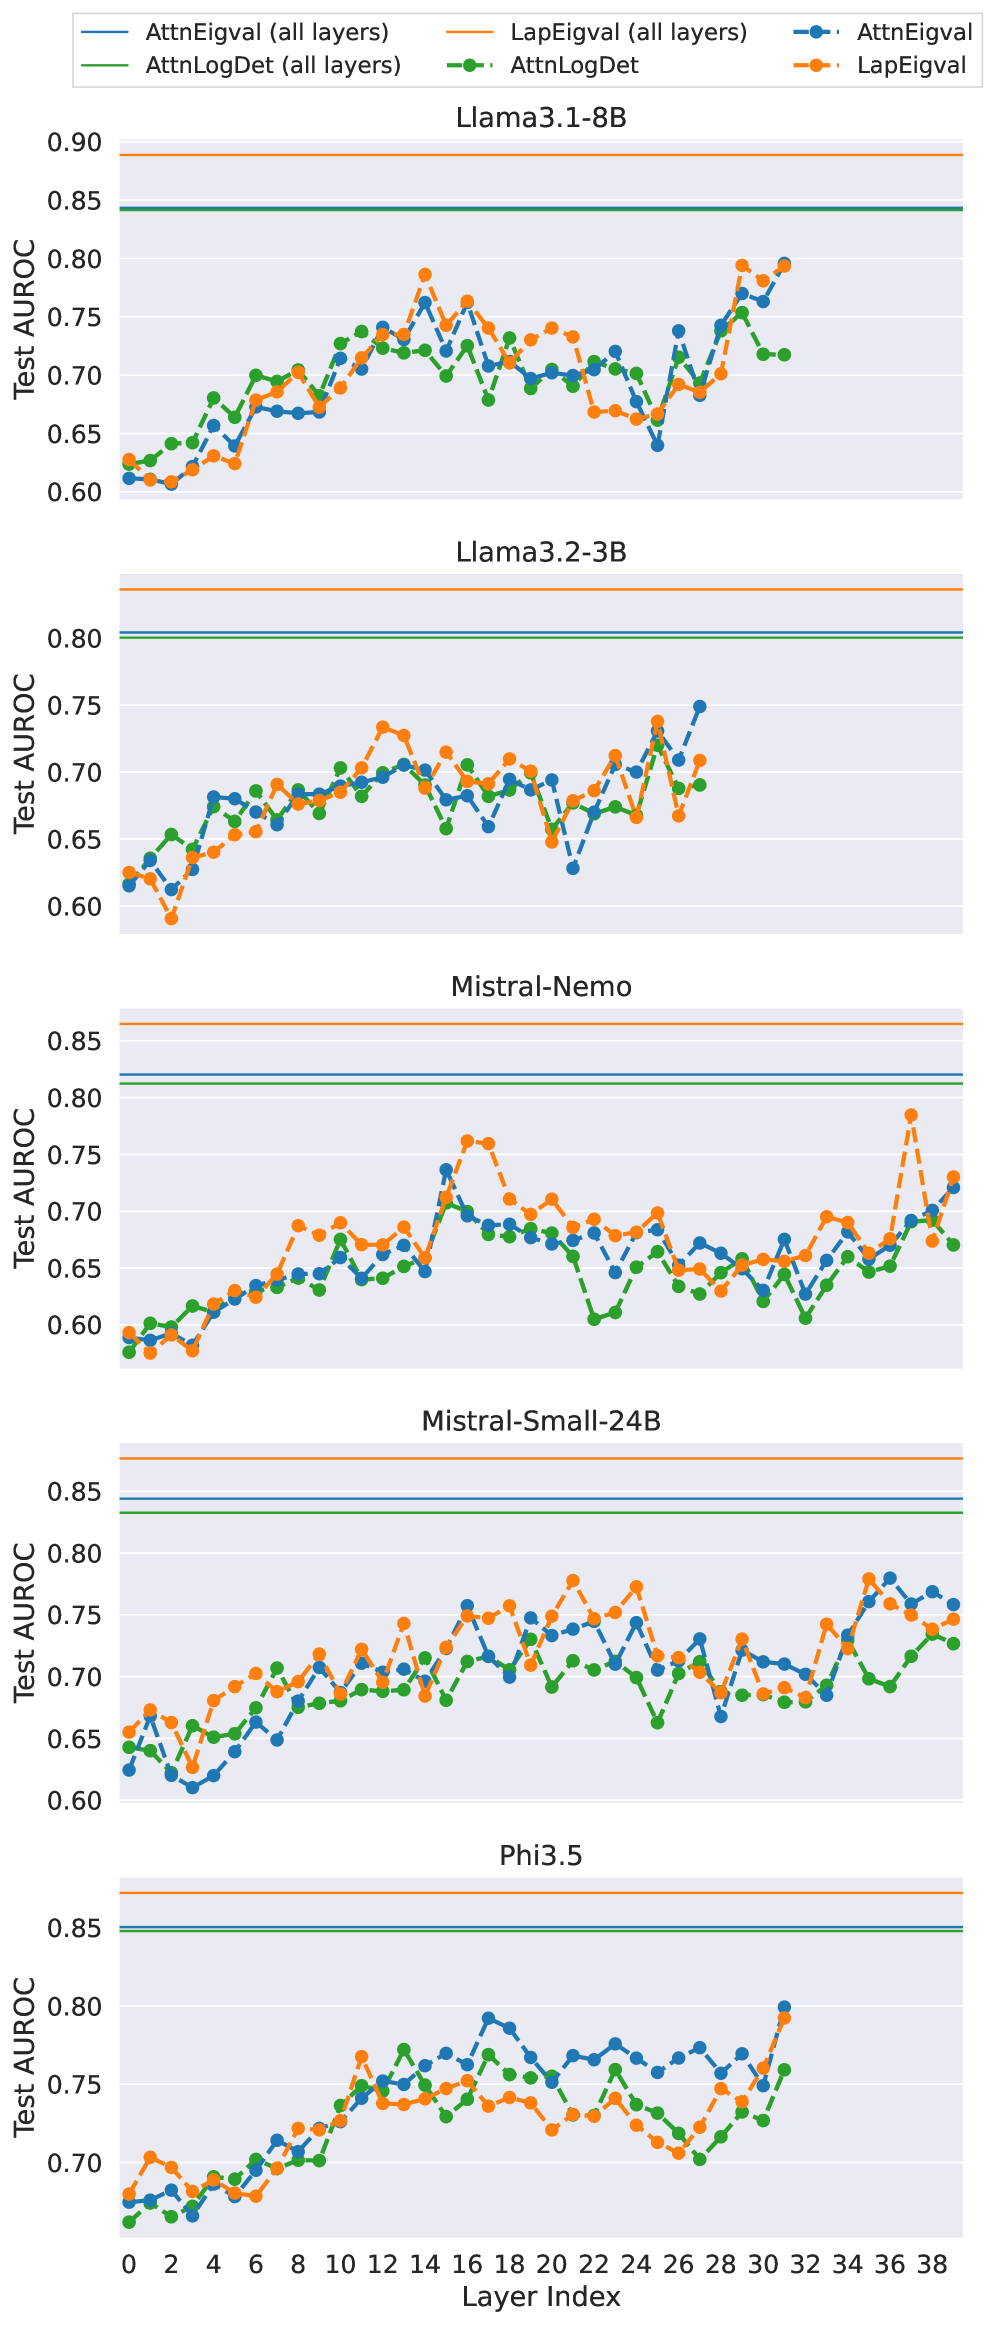
The chart compares test AUROC (Area Under the ROC Curve) performance across different neural network layers for five models: Llama3.1-8B, Llama3.2-3B, Mistral-Nemo, Mistral-Small-24B, and Phi3.5. Two metrics are tracked per model: "AttnEigval (all layers)" (solid lines) and "LapEigval (all layers)" (dashed lines), with distinct color coding for each model.
### Components/Axes
- **X-axis**: Layer Index (0–38), representing neural network layers.
- **Y-axis**: Test AUROC (0.60–0.90), normalized performance metric.
- **Legend**: Located at top-left, mapping models to colors and line styles:
- Llama3.1-8B: Blue (AttnEigval), Orange (LapEigval)
- Llama3.2-3B: Green (AttnEigval), Orange (LapEigval)
- Mistral-Nemo: Blue (AttnEigval), Orange (LapEigval)
- Mistral-Small-24B: Green (AttnEigval), Orange (LapEigval)
- Phi3.5: Blue (AttnEigval), Orange (LapEigval)
### Detailed Analysis
1. **Llama3.1-8B**:
- AttnEigval (solid blue): Starts at ~0.62, peaks at ~0.78 (layer 16), ends at ~0.74.
- LapEigval (dashed orange): Starts at ~0.60, peaks at ~0.79 (layer 16), ends at ~0.73.
2. **Llama3.2-3B**:
- AttnEigval (solid green): Starts at ~0.63, peaks at ~0.76 (layer 16), ends at ~0.72.
- LapEigval (dashed orange): Starts at ~0.61, peaks at ~0.77 (layer 16), ends at ~0.71.
3. **Mistral-Nemo**:
- AttnEigval (solid blue): Starts at ~0.60, peaks at ~0.77 (layer 16), ends at ~0.73.
- LapEigval (dashed orange): Starts at ~0.62, peaks at ~0.78 (layer 16), ends at ~0.74.
4. **Mistral-Small-24B**:
- AttnEigval (solid green): Starts at ~0.61, peaks at ~0.76 (layer 16), ends at ~0.72.
- LapEigval (dashed orange): Starts at ~0.63, peaks at ~0.77 (layer 16), ends at ~0.73.
5. **Phi3.5**:
- AttnEigval (solid blue): Starts at ~0.65, peaks at ~0.80 (layer 24), ends at ~0.76.
- LapEigval (dashed orange): Starts at ~0.64, peaks at ~0.79 (layer 24), ends at ~0.75.
### Key Observations
- **Consistent Peaks**: All models show performance peaks around layer 16, suggesting this layer is critical for AUROC optimization.
- **LapEigval Superiority**: Dashed orange lines (LapEigval) generally outperform solid lines (AttnEigval) across most models, with differences up to 0.03 AUROC.
- **Phi3.5 Anomaly**: Exhibits the highest absolute performance (up to 0.80 AUROC) and the most pronounced layer-specific variation.
- **Layer 0 Baseline**: All models start near 0.60–0.65 AUROC, indicating minimal performance in initial layers.
### Interpretation
The data suggests that Laplacian eigenvalues (LapEigval) consistently contribute more to model performance than attention eigenvalues (AttnEigval) across all tested architectures. The layer 16 peak implies a critical point in network depth where discriminative power is maximized. Phi3.5's superior performance and variability highlight its architectural efficiency. The convergence of trends across models indicates that layer-specific eigenvalue distributions are a robust predictor of AUROC, with LapEigval serving as a more stable performance indicator. This analysis could guide layer-wise optimization strategies in transformer-based models.