\n
## Scatter Plot: Accuracy vs. Time-to-Answer
### Overview
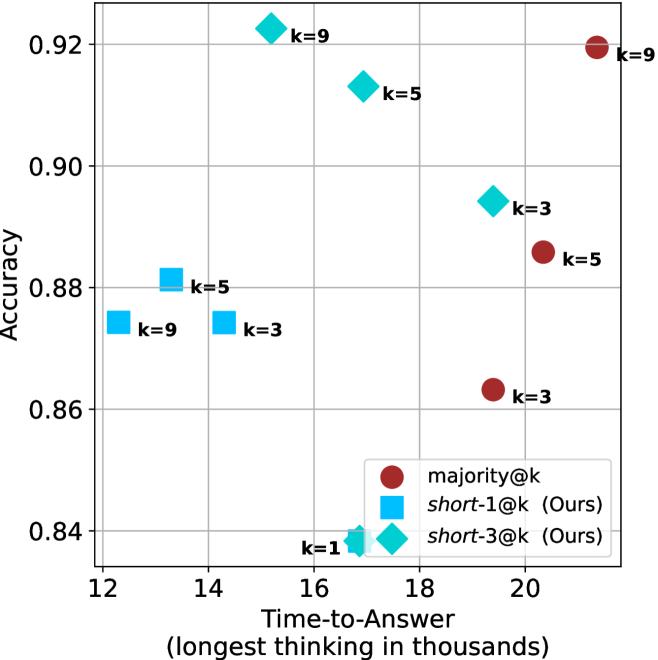
This image presents a scatter plot comparing the accuracy and time-to-answer for different values of 'k' across three methods: majority voting, short-1@k, and short-3@k. The x-axis represents "Time-to-Answer" in thousands of units, and the y-axis represents "Accuracy". Each point on the plot represents a specific combination of method and 'k' value.
### Components/Axes
* **X-axis:** Time-to-Answer (longest thinking in thousands) - Scale ranges from approximately 12 to 20.
* **Y-axis:** Accuracy - Scale ranges from approximately 0.84 to 0.93.
* **Legend:** Located in the bottom-right corner.
* Red circles: majority@k
* Light blue diamonds: short-1@k (Ours)
* Dark blue squares: short-3@k (Ours)
* **Data Points:** Each point is labeled with its corresponding 'k' value.
### Detailed Analysis
Let's analyze each data series individually:
**1. majority@k (Red Circles):**
* The trend is generally upward, with increasing 'k' values correlating with higher accuracy, but with diminishing returns.
* k=1: Approximately (19.5, 0.865)
* k=3: Approximately (18.5, 0.86)
* k=5: Approximately (19.2, 0.89)
* k=9: Approximately (20.2, 0.923)
**2. short-1@k (Light Blue Diamonds):**
* The trend is also upward, but appears to plateau more quickly than the majority@k series.
* k=1: Approximately (12.2, 0.84)
* k=3: Approximately (14.2, 0.87)
* k=5: Approximately (16.5, 0.915)
* k=9: Approximately (17.5, 0.92)
**3. short-3@k (Dark Blue Squares):**
* This series shows a more erratic trend.
* k=1: Approximately (13.5, 0.88)
* k=3: Approximately (14.0, 0.87)
* k=5: Approximately (18.0, 0.88)
* k=9: Approximately (18.5, 0.88)
### Key Observations
* The 'short-1@k' method achieves high accuracy with relatively low time-to-answer, especially for smaller 'k' values.
* The 'majority@k' method consistently demonstrates the highest accuracy, but at the cost of increased time-to-answer.
* The 'short-3@k' method shows the most variability in performance, with accuracy not consistently improving with increasing 'k'.
* For k=9, majority@k has the highest accuracy, followed closely by short-1@k.
* The 'short-3@k' method appears to be less effective than the other two methods, particularly for larger 'k' values.
### Interpretation
This data suggests a trade-off between accuracy and time-to-answer. The 'majority@k' method prioritizes accuracy, while 'short-1@k' prioritizes speed. The 'short-3@k' method doesn't seem to offer a clear advantage over either of the other two.
The choice of method and 'k' value depends on the specific application and the relative importance of accuracy and speed. If high accuracy is critical, 'majority@k' with a larger 'k' value is the preferred choice. If speed is more important, 'short-1@k' with a smaller 'k' value is a better option.
The plateauing of the 'short-1@k' accuracy suggests that increasing 'k' beyond a certain point does not yield significant improvements in performance. This could be due to the inherent limitations of the method or the nature of the data. The erratic behavior of 'short-3@k' might indicate that it is more sensitive to noise or outliers in the data.
The data points are relatively sparse, making it difficult to draw definitive conclusions. Further investigation with a larger dataset and more granular 'k' values would be beneficial.