## Line Chart: Number of Collisions vs. Step Number for Different Model Variants
### Overview
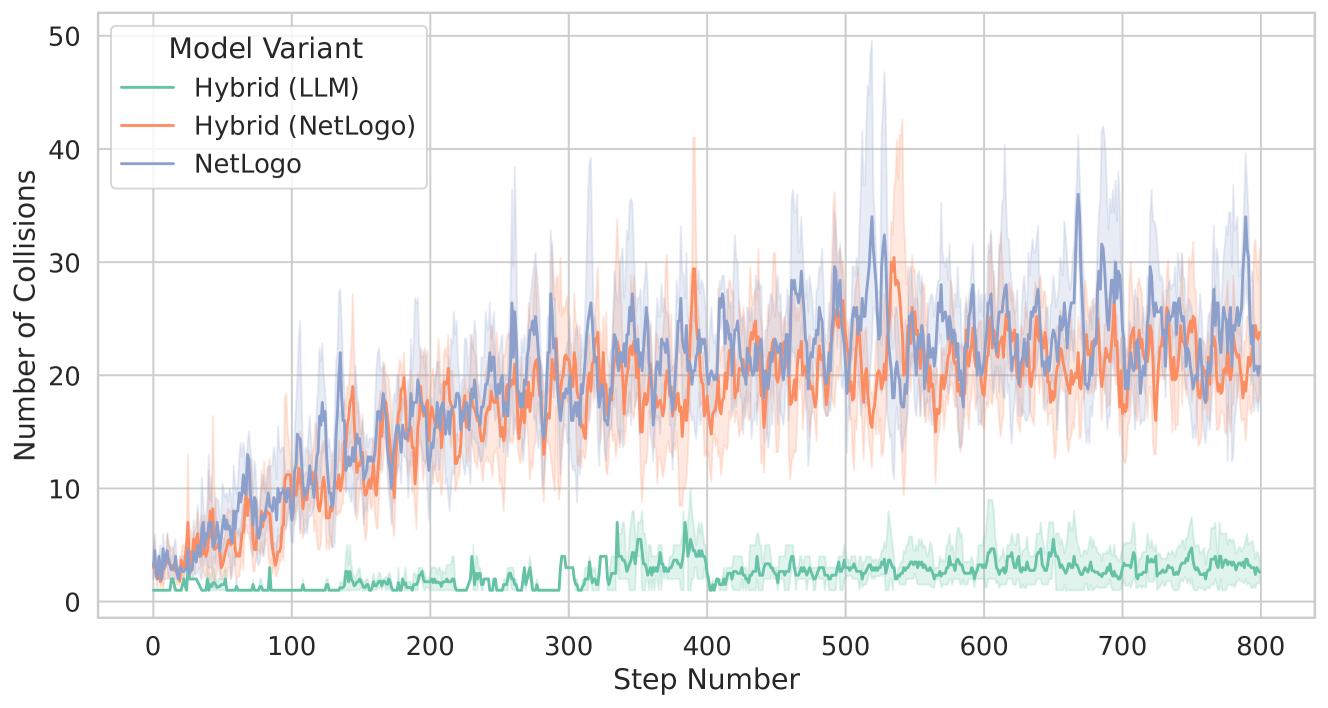
The image is a line chart comparing the number of collisions over time (step number) for three different model variants: Hybrid (LLM), Hybrid (NetLogo), and NetLogo. The chart displays the average number of collisions for each model, along with a shaded region indicating the variability or uncertainty around the average.
### Components/Axes
* **X-axis:** Step Number, ranging from 0 to 800 in increments of 100.
* **Y-axis:** Number of Collisions, ranging from 0 to 50 in increments of 10.
* **Legend (Top-Left):**
* Hybrid (LLM) - Green line
* Hybrid (NetLogo) - Orange line
* NetLogo - Blue line
### Detailed Analysis
* **Hybrid (LLM) - Green Line:**
* Trend: The number of collisions remains relatively low and stable throughout the simulation, generally staying below 10.
* Data Points: Starts around 1-2 collisions. Fluctuates between 1 and 7 collisions for most of the steps.
* **Hybrid (NetLogo) - Orange Line:**
* Trend: The number of collisions increases initially, then fluctuates around an average of approximately 20-25 collisions after step 200.
* Data Points: Starts around 3-4 collisions. Increases to approximately 20 collisions by step 200. Fluctuates between 15 and 30 collisions for the remaining steps.
* **NetLogo - Blue Line:**
* Trend: Similar to Hybrid (NetLogo), the number of collisions increases initially, then fluctuates around an average of approximately 20-25 collisions after step 200. The variability (shaded region) appears slightly larger than that of Hybrid (NetLogo).
* Data Points: Starts around 3-4 collisions. Increases to approximately 20 collisions by step 200. Fluctuates between 15 and 35 collisions for the remaining steps.
### Key Observations
* The Hybrid (LLM) model consistently exhibits significantly fewer collisions compared to the other two models.
* The Hybrid (NetLogo) and NetLogo models show similar trends in the number of collisions, with both increasing initially and then fluctuating around a similar average.
* The shaded regions around the lines indicate the variability in the number of collisions for each model. The NetLogo model appears to have slightly higher variability than the Hybrid (NetLogo) model.
### Interpretation
The data suggests that integrating a Large Language Model (LLM) into the hybrid model significantly reduces the number of collisions compared to using only NetLogo or a hybrid NetLogo approach. This could indicate that the LLM is better at guiding agents to avoid collisions or that it introduces a mechanism that inherently reduces collisions. The similar performance of the Hybrid (NetLogo) and NetLogo models suggests that simply combining NetLogo with itself does not significantly impact the number of collisions. The variability in the number of collisions for the NetLogo model may indicate that its behavior is less predictable or more sensitive to initial conditions compared to the Hybrid (NetLogo) model.