\n
## Line Chart: Collision Count vs. Step Number for Different Model Variants
### Overview
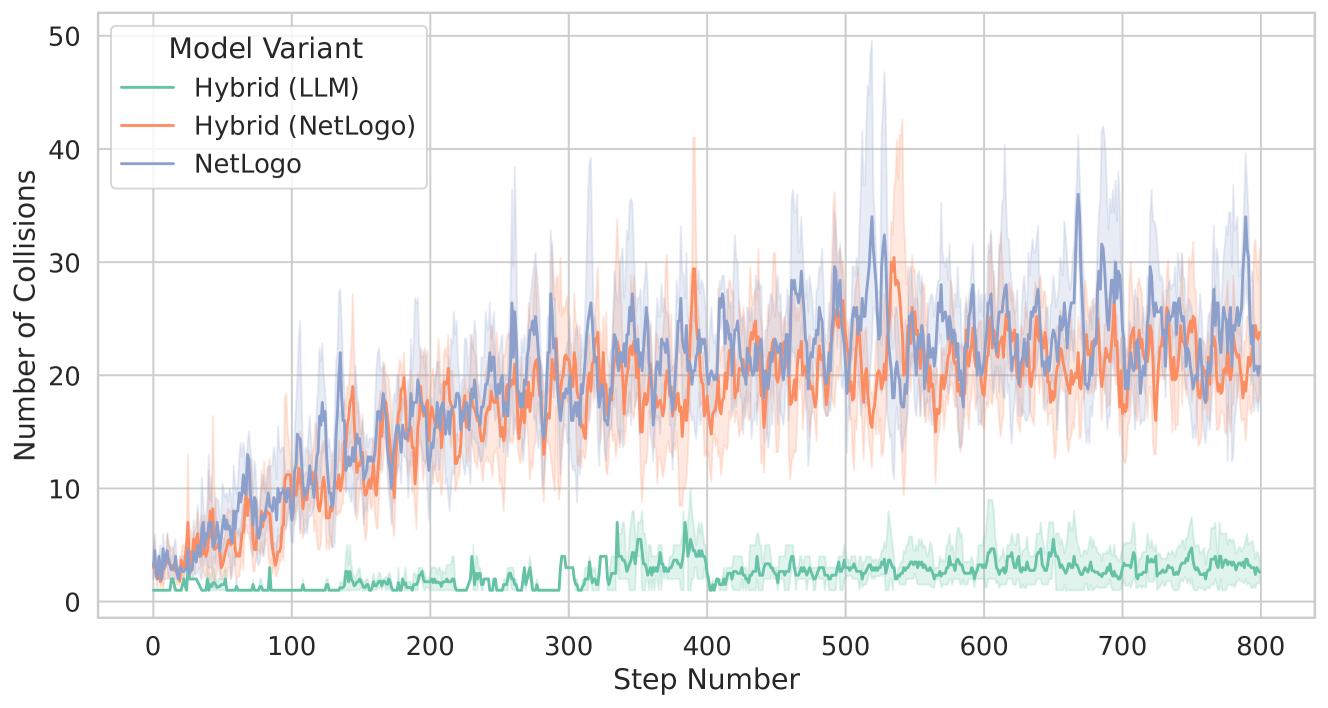
This line chart visualizes the number of collisions over a series of steps for three different model variants: Hybrid (LLM), Hybrid (NetLogo), and NetLogo. The chart appears to be tracking the performance of these models in a simulation or environment where collisions are a measurable event. The x-axis represents the step number, and the y-axis represents the number of collisions. The chart uses shaded areas to represent the variance around the mean for each model.
### Components/Axes
* **X-axis Title:** "Step Number" - Scale ranges from approximately 0 to 800.
* **Y-axis Title:** "Number of Collisions" - Scale ranges from approximately 0 to 50.
* **Legend:** Located in the top-left corner.
* "Model Variant" - Title of the legend.
* "Hybrid (LLM)" - Represented by a light green line with a shaded area.
* "Hybrid (NetLogo)" - Represented by a teal line with a shaded area.
* "NetLogo" - Represented by an orange-brown line with a shaded area.
* **Gridlines:** Present throughout the chart for easier readability.
### Detailed Analysis
The chart displays three lines, each representing a different model variant. Each line is accompanied by a shaded area, indicating the variability or standard deviation around the mean collision count.
* **Hybrid (LLM):** The light green line starts at approximately 2 collisions at Step 0, fluctuates between 2 and 8 collisions for the first 200 steps, and then remains relatively stable around 2-5 collisions for the remainder of the simulation (Steps 200-800). The shaded area is narrow, indicating low variability.
* **Hybrid (NetLogo):** The teal line begins at approximately 6 collisions at Step 0. It exhibits significant fluctuations, ranging from approximately 10 to 35 collisions throughout the simulation. The shaded area is wider than that of Hybrid (LLM), indicating higher variability. There is a noticeable peak around Step 500, reaching approximately 35 collisions.
* **NetLogo:** The orange-brown line starts at approximately 4 collisions at Step 0. It also shows considerable fluctuations, generally between 10 and 25 collisions. The shaded area is similar in width to Hybrid (NetLogo), suggesting comparable variability. There is a peak around Step 250, reaching approximately 25 collisions, and another around Step 550, reaching approximately 30 collisions.
### Key Observations
* The Hybrid (LLM) model consistently exhibits the lowest number of collisions throughout the simulation.
* Both Hybrid (NetLogo) and NetLogo models show significantly higher and more variable collision counts compared to Hybrid (LLM).
* The Hybrid (NetLogo) model appears to have a peak in collisions around Step 500, while the NetLogo model has peaks around Steps 250 and 550.
* The shaded areas indicate that the Hybrid (LLM) model is the most stable, while the other two models exhibit greater variability in collision counts.
### Interpretation
The data suggests that the Hybrid (LLM) model is significantly more effective at avoiding collisions than the Hybrid (NetLogo) and NetLogo models within this simulated environment. The consistently low collision count and narrow shaded area indicate a more stable and predictable performance. The higher collision counts and wider shaded areas for the other two models suggest that they are more prone to collisions and exhibit greater variability in their behavior.
The peaks in collision counts for the Hybrid (NetLogo) and NetLogo models may indicate specific events or conditions within the simulation that trigger increased collision rates. Further investigation would be needed to determine the cause of these peaks. The difference in performance between the models could be due to differences in their underlying algorithms, parameters, or how they interact with the simulated environment. The LLM component in the Hybrid (LLM) model may be providing a more effective strategy for collision avoidance.
The chart provides valuable insights into the relative performance of these models and highlights the potential benefits of incorporating LLM technology into collision avoidance systems.