## Line Graph: Number of Collisions Over Training Steps for Model Variants
### Overview
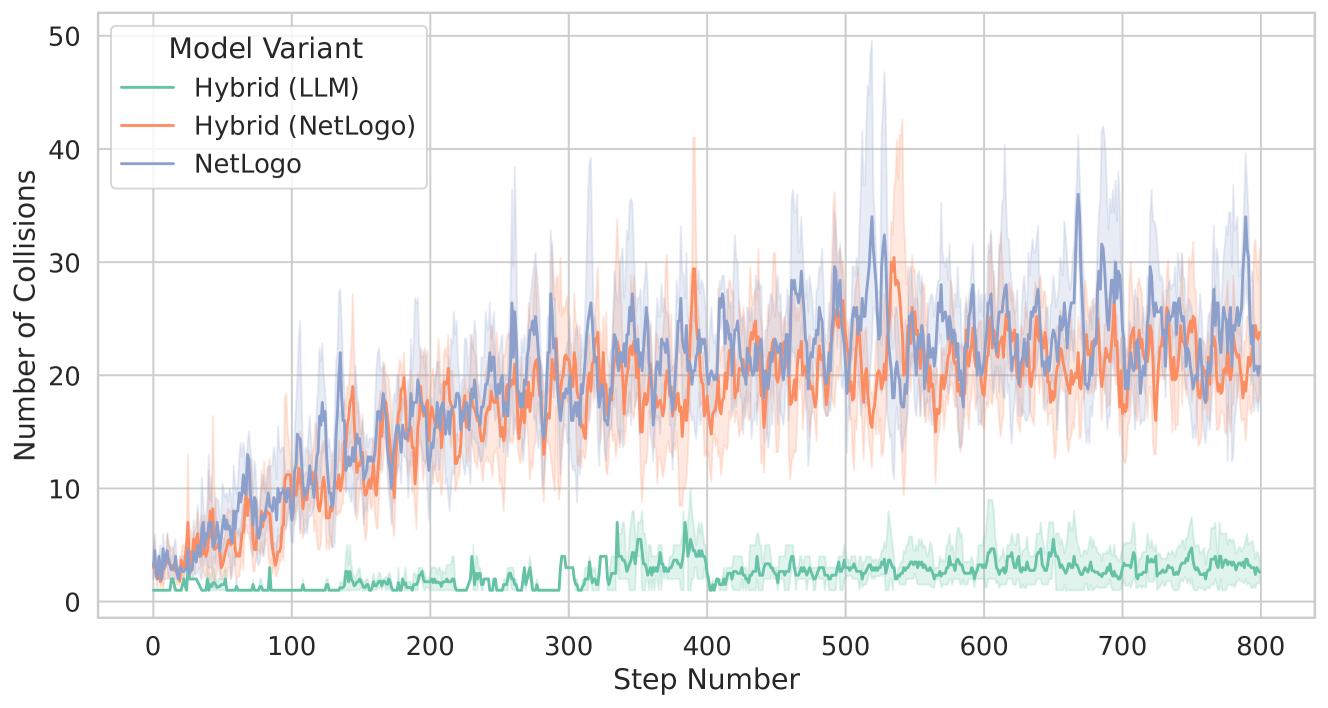
The graph displays the number of collisions during training steps for three model variants: Hybrid (LLM), Hybrid (NetLogo), and NetLogo. The y-axis represents collisions (0–50), and the x-axis represents training steps (0–800). All lines show increasing collision counts over time, with distinct patterns in variability and magnitude.
### Components/Axes
- **X-axis (Step Number)**: Ranges from 0 to 800 in increments of 100.
- **Y-axis (Number of Collisions)**: Ranges from 0 to 50 in increments of 10.
- **Legend**: Located in the top-left corner, with three entries:
- **Green**: Hybrid (LLM)
- **Orange**: Hybrid (NetLogo)
- **Blue**: NetLogo
- **Shaded Regions**: Light-colored bands around each line indicate confidence intervals or variability ranges.
### Detailed Analysis
1. **Hybrid (LLM) (Green Line)**:
- Starts near 0 collisions at step 0.
- Remains consistently below 10 collisions throughout training.
- Shows minor fluctuations (e.g., peaks at ~5–7 collisions around steps 300–400).
- Confidence interval (shaded green) is narrow, indicating low variability.
2. **Hybrid (NetLogo) (Orange Line)**:
- Begins near 5 collisions at step 0.
- Peaks at ~40 collisions around step 500, with sharp spikes (e.g., 45–50 collisions).
- Ends at ~25 collisions at step 800.
- Confidence interval (shaded orange) is wide, reflecting high variability.
3. **NetLogo (Blue Line)**:
- Starts near 5 collisions at step 0.
- Maintains a steady range of 15–30 collisions throughout training.
- Peaks at ~35 collisions around step 600.
- Confidence interval (shaded blue) is moderately wide, showing moderate variability.
### Key Observations
- **Hybrid (LLM)** demonstrates the lowest and most stable collision count, suggesting superior performance in minimizing collisions.
- **Hybrid (NetLogo)** exhibits the highest variability, with dramatic spikes (e.g., step 500) and a final collision count (~25) higher than Hybrid (LLM).
- **NetLogo** shows intermediate performance, with stable but higher collision counts (~20–30) compared to Hybrid (LLM).
- All models show an overall upward trend in collisions, though Hybrid (LLM) mitigates this trend more effectively.
### Interpretation
The data suggests that the **Hybrid (LLM)** model variant is the most effective at reducing collisions during training, likely due to the integration of LLM-based optimizations. The **Hybrid (NetLogo)** variant, while outperforming the standalone **NetLogo** model, suffers from instability (e.g., step 500 spike), indicating potential issues with its training dynamics. The shaded regions highlight that variability in collision counts is highest for Hybrid (NetLogo), which may reflect sensitivity to hyperparameters or environmental factors. The consistent performance of Hybrid (LLM) implies that LLM-driven adjustments provide robustness in collision avoidance, making it the preferred variant for applications requiring stability.